. 2009 Jan 12;184(1):83-99.
doi: 10.1083/jcb.200806049.

Bone morphogenetic protein 2 induces pulmonary angiogenesis via Wnt-beta-catenin and Wnt-RhoA-Rac1 pathways

Affiliations

Bone morphogenetic protein 2 induces pulmonary angiogenesis via Wnt-beta-catenin and Wnt-RhoA-Rac1 pathways

Vinicio A de Jesus Perez et al. J Cell Biol. .

Abstract

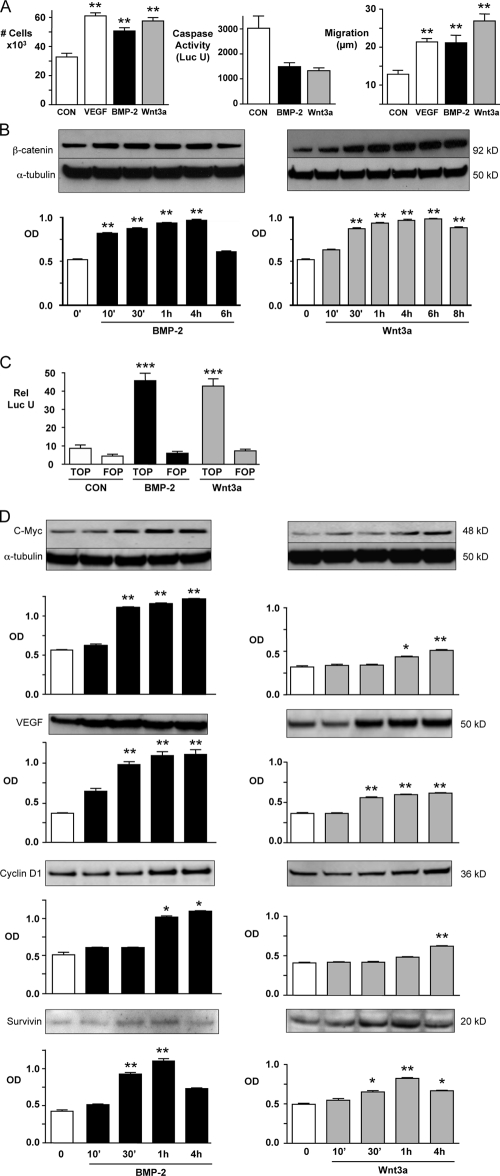
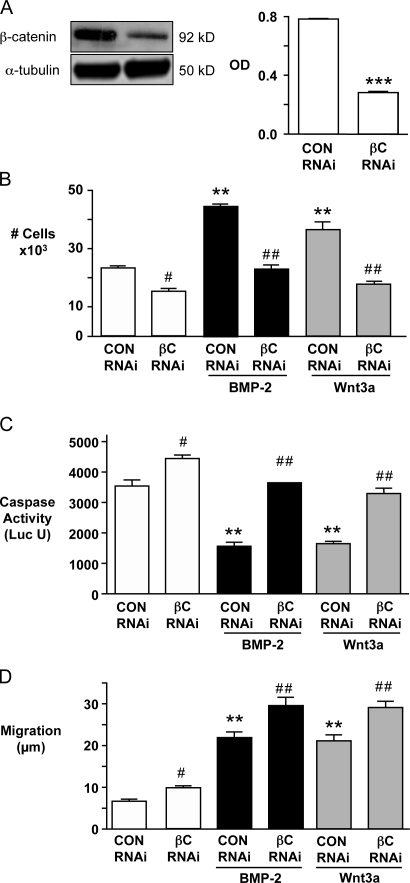
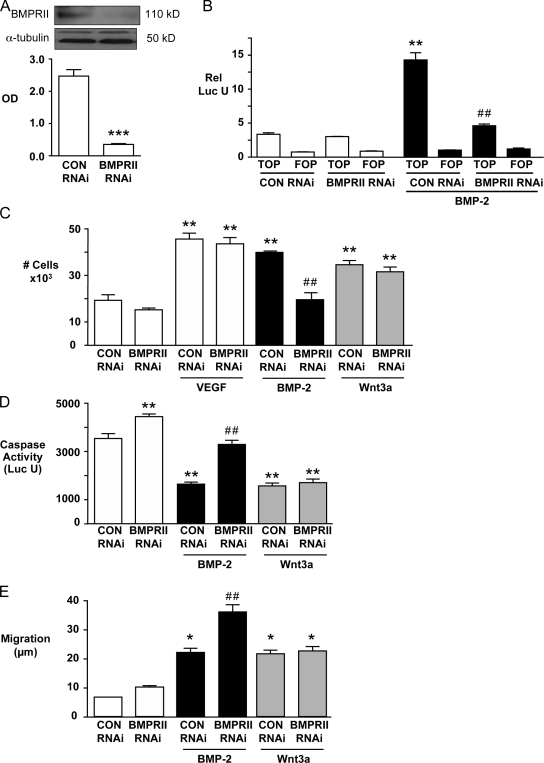
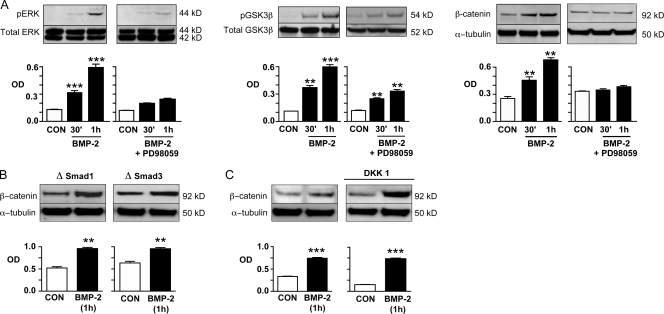
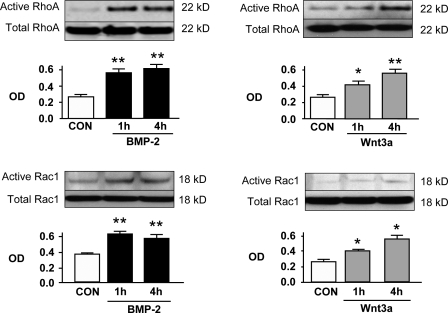
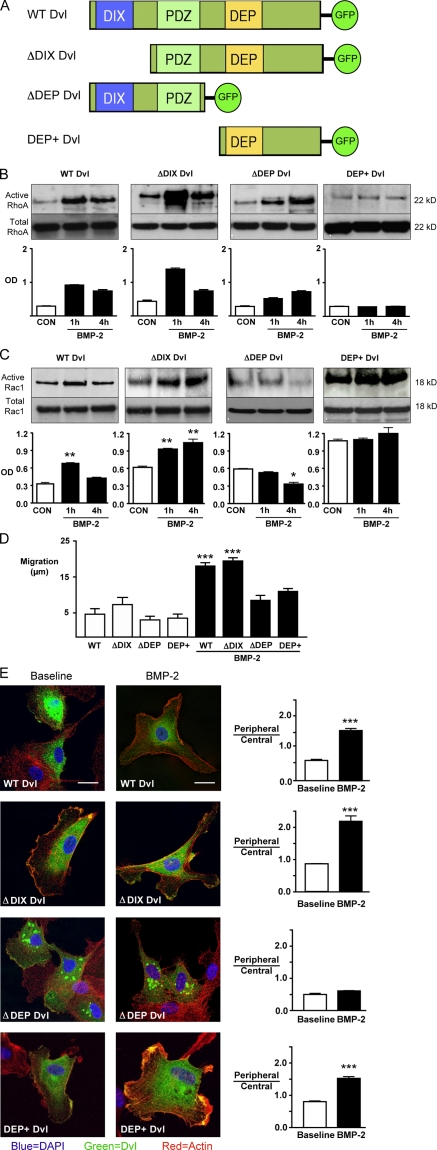
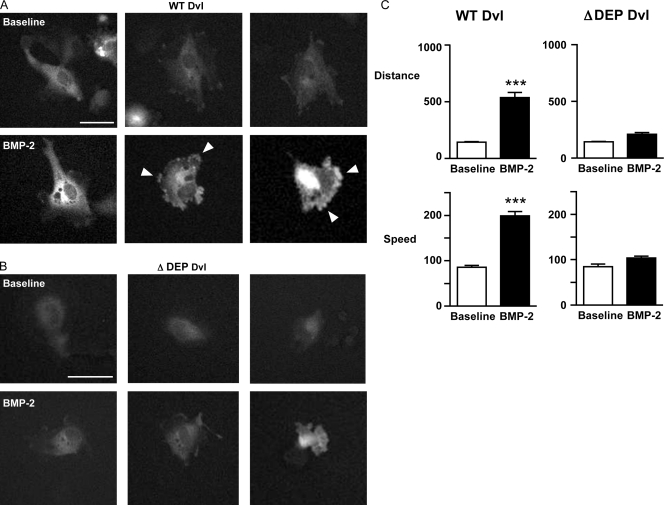
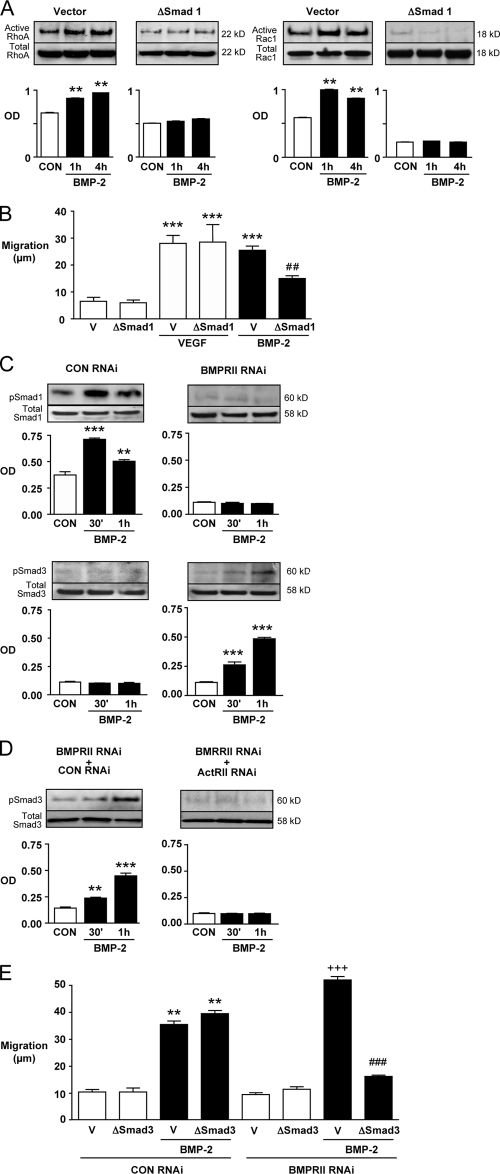
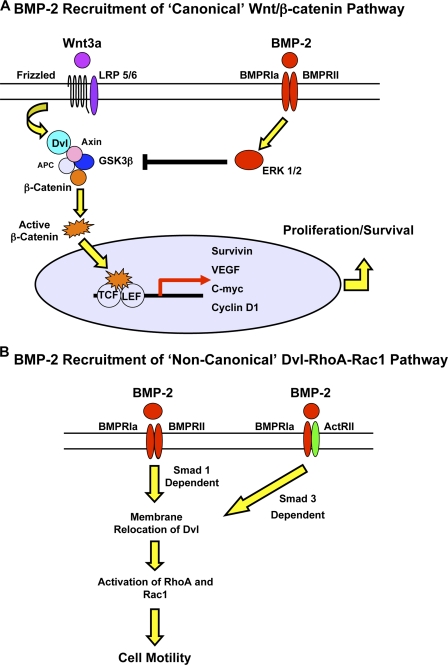
Mutations in bone morphogenetic protein (BMP) receptor II (BMPRII) are associated with pulmonary artery endothelial cell (PAEC) apoptosis and the loss of small vessels seen in idiopathic pulmonary arterial hypertension. Given the low penetrance of BMPRII mutations, abnormalities in other converging signaling pathways may be necessary for disease development. We hypothesized that BMPRII supports normal PAEC function by recruiting Wingless (Wnt) signaling pathways to promote proliferation, survival, and motility. In this study, we report that BMP-2, via BMPRII-mediated inhibition of GSK3-beta, induces beta-catenin (beta-C) accumulation and transcriptional activity necessary for PAEC survival and proliferation. At the same time, BMP-2 mediates phosphorylated Smad1 (pSmad1) or, with loss of BMPRII, pSmad3-dependent recruitment of Disheveled (Dvl) to promote RhoA-Rac1 signaling necessary for motility. Finally, using an angiogenesis assay in severe combined immunodeficient mice, we demonstrate that both beta-C- and Dvl-mediated RhoA-Rac1 activation are necessary for vascular growth in vivo. These findings suggest that the recruitment of both canonical and noncanonical Wnt pathways is required in BMP-2-mediated angiogenesis.


Figures

Figure 1.
Figure 1.
BMP-2 and Wnt3a promote proliferation, migration, and survival of hPAECs while increasing β-C transcriptional activity and target genes. (A) Cell count, caspase 3/7 apoptosis, and microcarrier bead migration assays of hPAECs in the presence or absence of 10 ng/ml BMP-2 or 100 ng/ml Wnt3a. Serum-free conditions were used to induce apoptosis, whereas 50 ng/ml of recombinant human VEGF was used as a positive control for proliferation and motility. (B) Representative Western immunoblots (top) and densitometry values (bottom) for β-C normalized to α-tubulin in response to BMP-2 and Wnt3a stimulation as in A. (C) TOPflash luciferase assays. hPAECs were transfected with TOPflash or FOPflash (negative control) luciferase reporter plasmids or Renilla (control for transfection efficiency). 6 h after stimulation with BMP-2 and Wnt3a, lysates were analyzed for luciferase activity relative to Renilla. CON, control. (D) Representative immunoblots for c-myc, VEGF, cyclin D1, and survivin in lysates of hPAEC stimulated with Wnt3a or BMP-2 as described in A. Values were normalized for α-tubulin. Error bars represent mean ± SEM from four different experiments performed in triplicate. *, P < 0.01; **, P < 0.001; ***, P < 0.0001 (vs. unstimulated control).
Figure 2.
Figure 2.
Knockdown of β-C reduces the proliferation and survival response of hPAECs to BMP-2 and Wnt3a but enhances their migratory response. (A) Western immunoblots for β-C and α-tubulin of hPAECs nucleofected with nontargeting control (CON RNAi) and β-C–specific siRNA (βC RNAi). ***, P < 0.0001 (compared with nontargeting control). (B–D) Cell proliferation (B), caspase 3/7 activity (C), and cell migration (D) assays using cells nucleofected with nontargeting or β-C–specific siRNA were performed as in Fig. 1. Error bars represent mean ± SEM from three different experiments performed in triplicate. **, P < 0.001 (BMP-2 or Wnt3a vs. unstimulated nontargeting control); #, P < 0.01 and ##, P < 0.001 (β-C–specific siRNA vs. corresponding nontargeting control).
Figure 3.
Figure 3.
Knockdown of BMPRII reduces BMP-2–mediated proliferation and survival of hPAECs but enhances their migratory response. (A) Western immunoblots for BMPRII and α-tubulin in hPAECs nucleofected with nontargeting control (CON RNAi) and BMPRII siRNA (BMPRII RNAi). Error bars denote mean ± SEM for three different assessments. ***, P < 0.0001 (vs. nontargeting control). (B) TOPflash activity assay. **, P < 0.001 (vs. nontargeting control); ##, P < 0.001 (vs. BMP-2–stimulated nontargeting control). (C–E) Cell proliferation (C), caspase 3/7 activity (D), and cell migration (E) assays using cells nucleofected with nontargeting or BMPRII-specific siRNA as in Fig. 1. (B–E) Error bars represent mean ± SEM from three different experiments performed in triplicate. *, P < 0.01 and **, P < 0.001 (vs. unstimulated nontargeting control); ##, P < 0.001 (vs. BMP-2– or Wnt3a–stimulated nontargeting control).
Figure 4.
Figure 4.
BMP-2 activation of β-C transcriptional activity in hPAECs is dependent on ERK. (A) Western immunoblots of hPAECs stimulated with BMP-2 in the presence or absence of 10 μM PD98059. Blots were probed for pERK, total ERK, GSK3-β, and β-C. (B) Western immunoblots of hPAECs transfected with dominant-negative (Δ) Smad1 or -3 constructs and stimulated with 10 ng/ml BMP-2 for 1 h. Blots were probed for active β-C and α-tubulin as a loading control (CON). (C) Western immunoblots of hPAECs incubated with 10 ng/ml BMP-2 in the presence or absence of 500 ng/ml DKK 1 for 1 h. Blots were probed for active β-C and α-tubulin as a loading control. Error bars denote mean ± SEM for three different experiments performed in triplicate. **, P < 0.001 and ***, P < 0.0001 (vs. control).
Figure 5.
Figure 5.
BMP-2 and Wnt3a increase levels of active RhoA and Rac1 in hPAECs. Active RhoA and Rac1 pull-down experiments were performed on hPAECs starved for 24 h followed by incubation with 10 ng/ml BMP-2 or 100 ng/ml Wnt3a for 1 and 4 h. Representative immunoblots for RhoA and Rac1 are shown along with densitometry. Levels of active RhoA and Rac1 were measured against total RhoA and Rac1 in cell lysates. Error bars denote mean ± SEM for three different experiments with triplicate assessments. *, P < 0.01 and **, P < 0.001 (vs. control [CON]).
Figure 6.
Figure 6.
BMP-2 recruits the PDZ and DEP domains of Dvl to activate RhoA and Rac1 and induce hPAEC motility. (A) Diagram illustrating the structure of the four Dvl-GFP constructs used in the experiments described in this study. (B and C) Dvl constructs illustrated in A were individually nucleofected in hPAECs to assess impact on RhoA (B) and Rac1 (C) activation in the presence of 10 ng/ml BMP-2. Pull-down experiments were performed and analyzed as in Fig. 5. Error bars denote mean ± SEM for three different experiments with triplicate assessments. *, P < 0.01 and **, P < 0.001 (vs. control [CON]). (D) Microcarrier bead migration assay of hPAECs nucleofected with Dvl constructs and exposed to BMP-2 as in A. ***, P < 0.0001 (vs. WT and ΔDIX unstimulated). (E) Representative confocal images of hPAECs nucleofected with GFP-tagged Dvl constructs. Cells were starved for 24 h and incubated with BMP-2 as in B. Actin was labeled with Alexa Fluor 555–phalloidin (red), and nuclei were stained with DAPI (blue). Quantification of Dvl distribution in the cytoplasm and the periphery was performed as described in Materials and methods. ***, P < 0.0001 (vs. baseline). (D and E) Error bars denote mean ± SEM for three different experiments with quadruplicate assessments. Bars, 10 μm.
Figure 7.
Figure 7.
BMP-2 facilitates redistribution of Dvl to filopodia and lamellipodia in hPAECs. (A and B) Live images taken over a 10-h period of cells nucleofected with Dvl-GFP (A) or ΔDEP Dvl-GFP (B) and stimulated with either vehicle or 10 ng/ml BMP-2. Arrowheads indicate the marked presence of GFP signal in the migrating front end of Dvl-GFP–transfected cells incubated with BMP-2. See Videos 1–4 (available at http://www.jcb.org/cgi/content/full/jcb.200806049/DC1). (C) The distance and speed of control and BMP-2–stimulated cells transfected with Dvl-GFP and ΔDEP Dvl-GFP. Distance was measured by plotting the coordinates of the nuclei every 10 min for 10 h and adding the distance between the points. Speed was calculated by dividing the distance over time (10 h). Error bars denote mean ± SEM for three different experiments with triplicate assessments. ***, P < 0.001 (vs. baseline). Bars, 10 μm.
Figure 8.
Figure 8.
Recruitment of Dvl by BMP-2 requires Smads and is independent of BMPRII functional status. (A) Active RhoA and Rac1 pull-down experiments on hPAEC nucleofected with either vector or dominant-negative (Δ) Smad1 construct and incubated with 10 ng/ml BMP-2 were analyzed as described in Fig. 6. **, P < 0.001 (vs. control [CON]). (B) Microcarrier bead assay using hPAECs nucleofected with vector (V) or ΔSmad1 was performed as in Fig. 6 D. ***, P < 0.0001 (vs. control); ##, P < 0.001 (vs. vector only stimulated with BMP-2). (C) Western immunoblots of BMP-2–stimulated hPAECs transfected with BMPRII siRNA or nontargeting control siRNA. Blots were probed for phosphorylated and total Smad1 and -3. **, P < 0.001 and ***, P < 0.0001 (vs. control). (D) Western immunoblots of hPAECs transfected with siRNA for both BMPRII and ActRIIa followed by stimulation with 10 ng/ml BMP-2 for 1 h. Blots were probed for phosphorylated and total Smad1 and -3. **, P < 0.001 and ***, P < 0.0001 (vs. control). (E) Microcarrier bead assay using hPAECs nucleofected with BMPRII siRNA along with vector or dominant-negative Smad3 (ΔSmad3). **, P < 0.001 (BMP-2–stimulated vector or ΔSmad3 vs. respective unstimulated control RNAi); +++, P < 0.0001 (BMP-2–stimulated vs. unstimulated BMPRII RNAi vector or ΔSmad3); ###, P < 0.0001 (vector vs. ΔSmad3). Error bars denote mean ± SEM for three different experiments with triplicate assessments.
Figure 9.
Figure 9.
Recruitment of both canonical and noncanonical signaling pathways is required for BMP-2–induced microvessel formation in SCID mice. (A–H) Representative immunofluorescence (A–D) and H&E (E–H) images show the appearance of unstimulated (A and E) and BMP-2–stimulated (B and F) controls and β-C RNAi–treated (C and G) and ΔDEP Dvl–transfected (D and F) cells 14 d after implantation into SCID mice. Human and murine CD31 are labeled with green and red fluorescent antibodies, respectively, and nuclei are stained blue with DAPI. Hybrid vessels containing green and red ECs (B) in association with RBC-filled vessels (F) are seen under conditions of BMP-2 stimulation (arrows) but not when the hPAECs were transfected with β-C RNAi (C and G) or with ΔDEP (D and H). (I and J) Quantitative analysis of the mean number of human (H) and murine (M) cells found per 40× field. Comparisons are made between unstimulated control and β-C RNAi–treated (I) or ΔDEP-transfected (J) versus BMP-2–stimulated counterparts. Error bars denote mean ± SEM for four different experiments. *, P < 0.01; **, P < 0.001; ***, P < 0.0001 (vs. same lineage control [CON]; human or murine). ##, P < 0.001; ###, P < 0.0001 (human vs. murine). +++, P < 0.0001 (lineage-specific control vs. experimental [βC RNAi or ΔDEP]). Bars: (A–D) 10 μm; (E–H) 30 μm.
Figure 10.
Figure 10.
Schema illustrating that regulation of proliferation, survival, and migration in hPAECs depends on cross talk between BMP and Wnt pathways. (A) BMP-2 and Wnt3a promote an increase in β-C–mediated transcriptional activity and up-regulate gene targets involved in proliferation and survival. (B) However, migration is the result of a Smad1 or, with reduced BMPRII, a Smad3-dependent recruitment of Dvl, which allows selective activation of RhoA, Rac1, and downward targets involved with cytoskeletal reorganization and cell motility.

References

    1. Adams, R.H., and K. Alitalo. 2007. Molecular regulation of angiogenesis and lymphangiogenesis. Nat. Rev. Mol. Cell Biol. 8:464–478. - PubMed
    1. Asosingh, K., M.A. Aldred, A. Vasanji, J. Drazba, J. Sharp, C. Farver, S.A. Comhair, W. Xu, L. Licina, L. Huang, et al. 2008. Circulating angiogenic precursors in idiopathic pulmonary arterial hypertension. Am. J. Pathol. 172:615–627. - PMC - PubMed
    1. Attisano, L., and J.L. Wrana. 2002. Signal transduction by the TGF-beta superfamily. Science. 296:1646–1647. - PubMed
    1. Axelrod, J.D., and H. McNeill. 2002. Coupling planar cell polarity signaling to morphogenesis. ScientificWorldJournal. 2:434–454. - PMC - PubMed
    1. Axelrod, J.D., J.R. Miller, J.M. Shulman, R.T. Moon, and N. Perrimon. 1998. Differential recruitment of Dishevelled provides signaling specificity in the planar cell polarity and Wingless signaling pathways. Genes Dev. 12:2610–2622. - PMC - PubMed

Publication types

MeSH terms