. 2009 Mar;29(6):1554-64.
doi: 10.1128/MCB.01421-08. Epub 2009 Jan 12.

The mitogen-activated protein kinase scaffold KSR1 is required for recruitment of extracellular signal-regulated kinase to the immunological synapse

Affiliations

The mitogen-activated protein kinase scaffold KSR1 is required for recruitment of extracellular signal-regulated kinase to the immunological synapse

Emanuele Giurisato et al. Mol Cell Biol. 2009 Mar.

Abstract

KSR1 is a mitogen-activated protein (MAP) kinase scaffold that enhances the activation of the MAP kinase extracellular signal-regulated kinase (ERK). The function of KSR1 in NK cell function is not known. Here we show that KSR1 is required for efficient NK-mediated cytolysis and polarization of cytolytic granules. Single-cell analysis showed that ERK is activated in an all-or-none fashion in both wild-type and KSR1-deficient cells. In the absence of KSR1, however, the efficiency of ERK activation is attenuated. Imaging studies showed that KSR1 is recruited to the immunological synapse during T-cell activation and that membrane recruitment of KSR1 is required for recruitment of active ERK to the synapse.


Figures
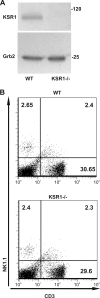
FIG. 1.
FIG. 1.
Normal numbers of NK cells in KSR1−/− mice. (A) Expression of KSR1 in splenocytes of WT and KSR1−/− mice. Total cell lysates of WT and KSR1−/− mice were analyzed by immunoblotting with anti-KSR1 antibody. Grb2 antibody was used as a loading control. (B) Splenocytes of WT and KSR1−/− mice were stained with NK1.1-PE and CD3ɛ-fluorescein isothiocyanate antibody and analyzed by flow cytometry. The dot blot is representative of three different experiments (two mice/experiment).
FIG. 2.
FIG. 2.
KSR1 is required for NK lytic activity in vitro and in vivo. (A and B) Cytotoxicity of WT and KSR1−/− NK cells was tested against YAC-1 cells (A) or RMAs and RMAs-Rae1ɛ target cells (B) in vitro. Purified NK cells (>96% NK1.1+ CD3ɛ) were IL-2 starved in RPMI medium for 4 h before incubation with the indicated target cells. Where indicated, NK cells were preincubated with the MEK inhibitor UO126 (10 μM). Data are representative of three independent experiments. E:T ratio, effector:target ratio. (C) Conjugate formation is normal in KSR1-deficient cells. NK cells from WT or KSR1−/− mice were stained with NK1.1-PE antibody and mixed with CFSE-loaded target cells. Cells were allowed to form conjugates for 20 min at 37°C, fixed, and analyzed by flow cytometry. The bar graphs represent the percentages of NK1.1+ CFSE+ double-positive cells from the total pool of NK1.1+ cells. Data are represented as averages ± standard errors of the means of at least three separate experiments. (D to G) NK killing assay in vivo. RMAs and RMAs-Rae1ɛ cells were labeled with different concentrations of CFSE and mixed at a 1:1 ratio. (D) An aliquot of the cell mixture was analyzed before injection (time zero). (E and F) The cell mixture was injected intraperitoneally into WT and KSR1−/− mice. Twenty-four hours after injection, cells were recovered by peritoneal lavage. Rae1ɛ expression was assessed by labeling with anti-Rae1ɛ antibody and examined by flow cytometry. The RMAs/RMAs-Rae1ɛ ratio was obtained by comparing high and low CFSE-labeled cells. (G) Summary of RMAs/RMAs-Rae1ɛ ratios in six WT and six KSR1−/− mice. Horizontal bars indicate the mean ratios.
FIG. 3.
FIG. 3.
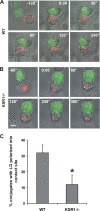
Lytic granule polarization is impaired in NK cells from KSR1−/− mice. (A and B) Time-lapse experiment, extracted from a movie, showing representative images of the localization of lytic granules (red) in primary NK cells purified from spleens of WT (A) and KSR1−/− (B) mice and conjugated with CFSE-loaded YAC-1 target cells (green; time in seconds). Bar, 5 μm. (C) Lytic granule (LG) polarization at the contact site with the indicated target cells was quantitated after 5 min of incubation. Data represent the mean (±standard error of the mean) percentage of conjugates from three independent experiments with at least 40 conjugates. *, P < 0.05.
FIG. 4.
FIG. 4.
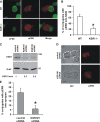
Recruitment of pERK into the NK IS is impaired in KSR1-deficient mice. (A) Representative images showing the localization of pERK (red) in primary NK cells purified from spleens of WT and KSR1−/− mice that were conjugated with CFSE-loaded YAC-1 target cells (green). Bar, 5 μm. (B) pERK accumulation at the NK IS was quantitated by dividing the percentage of cells with pERK at the NK IS by the total number of pERK-positive cells imaged. Data represent the mean (±standard error of the mean) percentage of conjugates with an RRI (see Materials and Methods) of >1.1, from three independent experiments with at least 30 conjugates. *, P < 0.05. (C) KSR1 knockdown in Jurkat T cells. Immunoblotting results are for KSR1 and Grb2 expression in Jurkat T cells (3.5 × 10⁶ cells/lane) transduced with the indicated shRNA. KSR1 expression levels were compared to control shRNA Jurkat T cells. (D) pERK recruitment into the contact site is impaired in KSR1 knockdown T cells. Representative differential interference contrast and Cy3 fluorescence images are shown for shRNA-expressing Jurkat T cells conjugated with Daudi B cells preloaded with 100 ng/ml of superantigen. Bar, 5 μm. (E) Percentage of conjugates with pERK recruited into the synapse, as described for panel D. Quantitative analysis was done for pERK accumulation at the contact site from three independent experiments with at least 40 conjugates. Data represent the mean (±standard error of the mean) percentage of conjugates with an RRI of >1.1. *, P < 0.05.
FIG. 5.
FIG. 5.
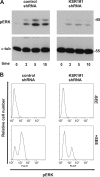
Antigen-induced T-cell activation is regulated by KSR1. (A) ERK activation is impaired in KSR1 knockdown T cells. shRNA-transduced Jurkat T cells were stimulated with superantigen-coated Daudi cells (100 ng/ml) for the indicated times (in minutes) and analyzed for pERK1/2 by Western blotting. Blotting for α-tubulin (α-tub) was used to demonstrate equal loading of each sample. (B) Suppression of KSR1 expression inhibits the number of activated Jurkat cells. Representative histograms show the distribution of pERK as measured by flow cytometry of Jurkat T cells after activation by Daudi preloaded with or without superantigen (10 ng/ml SEE). In the absence of stimulation, no shift in the x axis of histograms was observed in either control or KSR1 shRNA-expressing Jurkat cells. Notably, after stimulation the change in area under the peak indicates that ERK activation was observed in a higher number of control shRNA cells.
FIG. 6.
FIG. 6.
KSR1 is recruited into the immunological synapse. (A) Representative differential interference contrast, YFP, and Cy3 fluorescence images of Jurkat T cells expressing KSR1-YFP after conjugation with Daudi B cells loaded with or without SEE (100 ng/ml). In the absence of SEE (-SEE), ERK (red) is not phosphorylated and KSR1 (green) is not recruited into the contact site. In the far right panel, the location of pERK is shown in false color. Bar, 5 μm. (B) KSR1 and pERK accumulation at the contact site was quantitated from three independent experiments with at least 50 conjugates. Data are represented as the average (±standard error of the mean) of conjugates with an RRI of >1.1 (see Materials and Methods). (C) Representative differential interference contrast, YFP, and Cy3 fluorescence images of Jurkat T cells expressing YFP conjugated with Daudi B cells and stimulated as for panel A. Images are representative of two independent experiments with at least 30 conjugates.
FIG. 7.
FIG. 7.
KSR1 recruitment affected pERK accumulation into the contact site and antigen-induced T-cell activation. (A) Immunoblotting for KSR1 expression in Jurkat T cells (600 × 103 cells/lane) transduced with control shRNA, KSR1#1 shRNA, or rescue KSR1#1 shRNA lentivector containing KSR1(CCSS)-YFP or KSR1(WT)-YFP. Transduced Jurkat T cells with rescued CCSS mutant and WT KSR1 were sorted to achieve a pool of cells with similar expression levels (low and high) of KSR1-YFP. The KSR1 expression level compared to control shRNA transduced Jurkat T cells is indicated. (B) Representative histograms of the distribution of pERK as measured by flow cytometry of the indicated transduced Jurkat T cells after activation by Daudi cells preloaded without (-SEE) or with 1,000 ng/ml of superantigen (+SEE). (C) KSR1 is required for pERK recruitment into the IS. Images shown are representative of differential interference contrast (DIC), YFP (KSR1), and Cy3 (pERK) fluorescence images of KSR1#1 shRNA-KSR1(WT)-YFP or KSR1#1 shRNA-KSR1(CCSS)-YFP Jurkat T cells conjugated with Daudi B cells preloaded with SEE (100 ng/ml). In the far right panel, the location of pERK is shown in false color. Bar, 5 μm. (D) Quantitative analysis of KSR1 and pERK accumulation levels at the contact site from three independent experiments with at least 40 conjugates. Data are presented as the average (±standard error of the mean) of conjugates with an RRI (see Materials and Methods) of >1.1.
FIG. 8.
FIG. 8.
ERK phosphorylation of Lck is facilitated by KSR1 in NK cells. (A) Inhibition of KSR1 expression after KSR1-specific shRNA transduction in the human NK92 cell line (3 × 10⁶ cells/lane). Immunoblotting was performed with antibodies to KSR1 and Grb2. (B) Defective ERK activation in KSR1 knockdown NK92 cells. NK92 cells were stimulated with target cells (K562) for the indicated times (in minutes) and analyzed for pERK1/2 by Western blotting. Blotting with α-tubulin (α-tub) was used to demonstrate equal loading. (C) Serine phosphorylation of the Lck PXSP motif is facilitated by KSR1. Control and KSR1 shRNA-expressing NK92 cells were incubated with K562 cells as described for panel B. Lck immunoprecipitates were prepared at the indicated times (in minutes) and were resolved by sodium dodecyl sulfate-polyacrylamide gel electrophoresis and probed with a phospho-specific antibody to the sequence PXpSP. The membrane was then stripped and reprobed with monoclonal anti-Lck to confirm equal loading of Lck.

References

    1. Altan-Bonnet, G., and R. N. Germain. 2005. Modeling T cell antigen discrimination based on feedback control of digital ERK responses. PLoS Biol. 3:e356. - PMC - PubMed
    1. Apolloni, A., I. A. Prior, M. Lindsay, R. G. Parton, and J. F. Hancock. 2000. H-ras but not K-ras traffics to the plasma membrane through the exocytic pathway. Mol. Cell. Biol. 20:2475-2487. - PMC - PubMed
    1. Boles, K. S., W. Barchet, T. Diacovo, M. Cella, and M. Colonna. 2005. The tumor suppressor TSLC1/NECL-2 triggers NK-cell and CD8+ T-cell responses through the cell-surface receptor CRTAM. Blood 106:779-786. - PubMed
    1. Budhachandra, K., R. K. Brojen Singh, and G. I. Menon. 2008. Microtubule dynamics regulated by stathmin. Comput. Biol. Chem. 32:141-144. - PubMed
    1. Cella, M., K. Fujikawa, I. Tassi, S. Kim, K. Latinis, S. Nishi, W. Yokoyama, M. Colonna, and W. Swat. 2004. Differential requirements for Vav proteins in DAP10- and ITAM-mediated NK cell cytotoxicity. J. Exp. Med. 200:817-823. - PMC - PubMed

Substances

LinkOut - more resources