. 2009 Jul;33(5):453-62.
doi: 10.1002/gepi.20398.

Quantifying and correcting for the winner's curse in genetic association studies

Affiliations

Quantifying and correcting for the winner's curse in genetic association studies

Rui Xiao et al. Genet Epidemiol. 2009 Jul.

Abstract

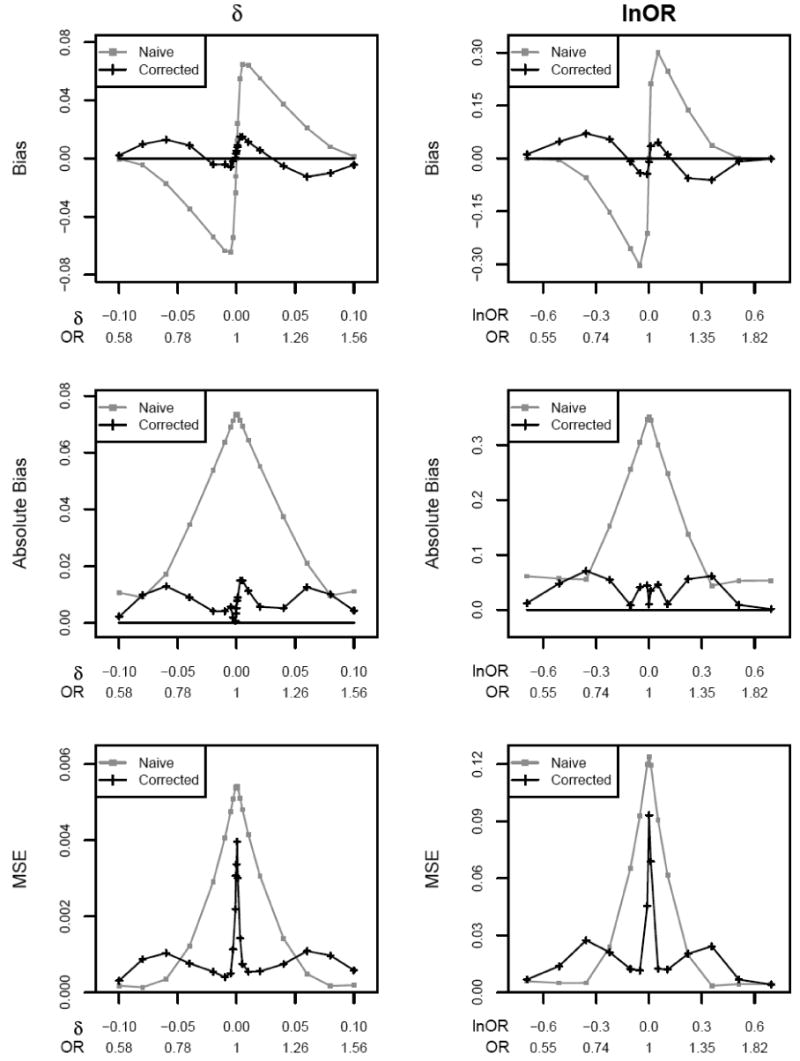
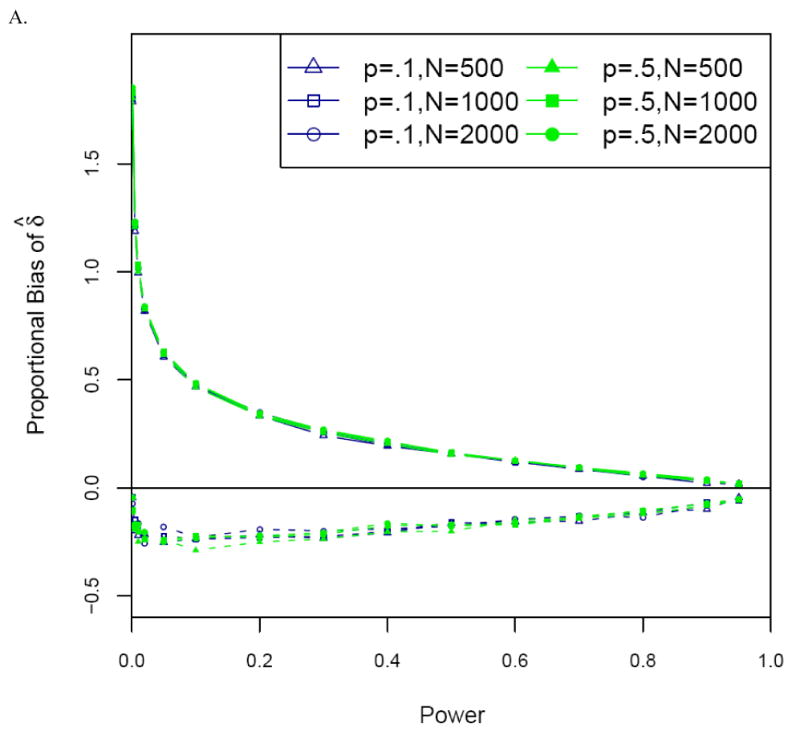
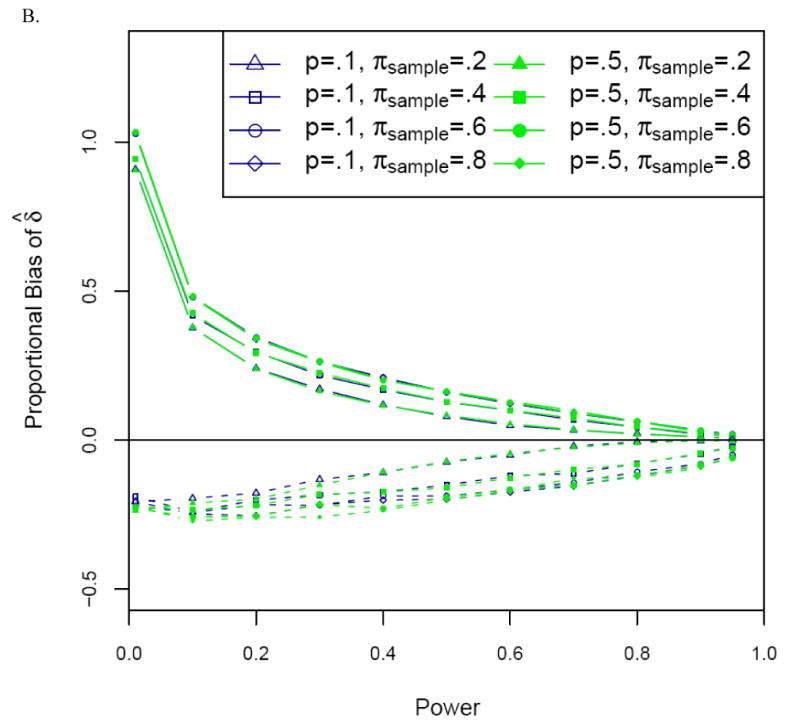
Genetic association studies are a powerful tool to detect genetic variants that predispose to human disease. Once an associated variant is identified, investigators are also interested in estimating the effect of the identified variant on disease risk. Estimates of the genetic effect based on new association findings tend to be upwardly biased due to a phenomenon known as the "winner's curse." Overestimation of genetic effect size in initial studies may cause follow-up studies to be underpowered and so to fail. In this paper, we quantify the impact of the winner's curse on the allele frequency difference and odds ratio estimators for one- and two-stage case-control association studies. We then propose an ascertainment-corrected maximum likelihood method to reduce the bias of these estimators. We show that overestimation of the genetic effect by the uncorrected estimator decreases as the power of the association study increases and that the ascertainment-corrected method reduces absolute bias and mean square error unless power to detect association is high.


Figures

Figure 1
Figure 1
Bias, absolute bias, and mean square error (MSE) for allele frequency difference δ and logarithm of odds ratio lnOR with sample size N = 1000 and control allele frequency p = .3. Significance level α = 10-6.
Figure 2
Figure 2
Proportional bias versus power for the uncorrected (naïve) (solid lines) and corrected (dashed lines) estimators of the (A) allele frequency difference δ and (B) odds ratio OR. Significance level α = 10-6. Results are presented only for δ > 0.
Figure 2
Figure 2
Proportional bias versus power for the uncorrected (naïve) (solid lines) and corrected (dashed lines) estimators of the (A) allele frequency difference δ and (B) odds ratio OR. Significance level α = 10-6. Results are presented only for δ > 0.
Figure 3
Figure 3
Proportional bias versus power for the uncorrected (naïve) (solid lines) and corrected (dashed lines) estimators of the allele frequency difference δ for (A) optimal and (B) non-optimal two-stage designs. Significance level α = 10-6. Designs optimal for multiplicative disease model with disease prevalence .10, stage 2 to stage 1 genotype cost ratio 30. For non-optimal designs, πmarker = 1%, and samples of N=1000 cases and N=1000 controls. Results are presented only for δ > 0.
Figure 3
Figure 3
Proportional bias versus power for the uncorrected (naïve) (solid lines) and corrected (dashed lines) estimators of the allele frequency difference δ for (A) optimal and (B) non-optimal two-stage designs. Significance level α = 10-6. Designs optimal for multiplicative disease model with disease prevalence .10, stage 2 to stage 1 genotype cost ratio 30. For non-optimal designs, πmarker = 1%, and samples of N=1000 cases and N=1000 controls. Results are presented only for δ > 0.
Figure 4
Figure 4
Distribution of the ascertainment-corrected MLE of the allele frequency difference δ for different power levels. Results are presented only for δ > 0. Based on 1000 simulation replicates of N=1000 cases and N=1000 controls, control allele frequency p = .5, and testing at significance level α = 10-6.

References

    1. Allison DB, Fernandez JR, Heo M, Zhu S, Etzel C, Beasley TM, Amos CI. Bias in estimates of quantitative-trait-locus effect in genome scans: demonstration of the phenomenon and a method-of-moments procedure for reducing bias. Am J Hum Genet. 2002;70:575–585. - PMC - PubMed
    1. Bazerman MH, Samuelson WF. I won the auction but don't want the prize. J Conflict Resolut. 1983;27:618–634.
    1. Carlin BP, Louis TA. Bayes and empirical Bayes methods for data analysis. 2nd. CRC Press; Boca Raton, FL: 2000.
    1. Garner C. Upward bias in odds ratio estimates from genome-wide association studies. Genet Epidemiol. 2007;31:288–295. - PubMed
    1. Ghosh A, Zou F, Wright FA. Estimating odds ratios in genome scans: an approximate conditional likelihood approach. Am J Hum Genet. 2008;82:1064–1074. - PMC - PubMed

Publication types