

Unbiased estimation of odds ratios: combining genomewide association scans with replication studies
- PMID: 19140132
- PMCID: PMC2726957
- DOI: 10.1002/gepi.20394
Unbiased estimation of odds ratios: combining genomewide association scans with replication studies
Abstract
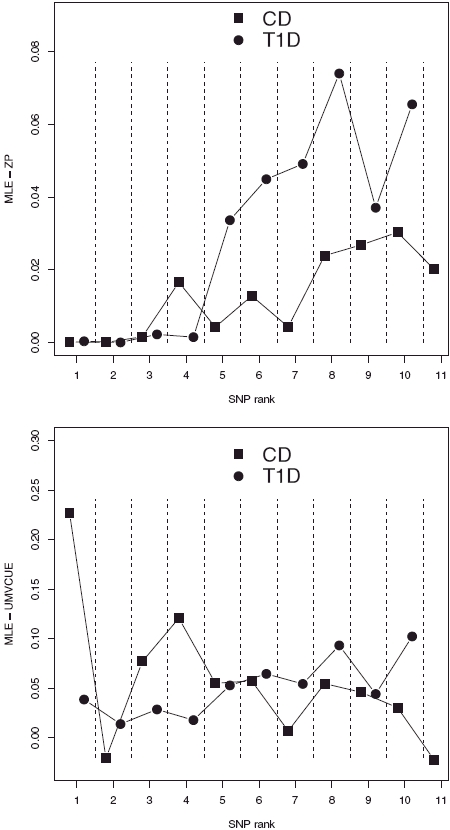
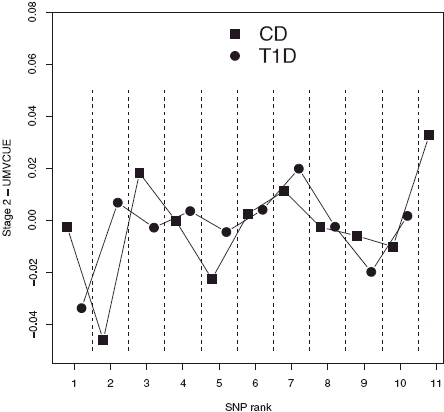
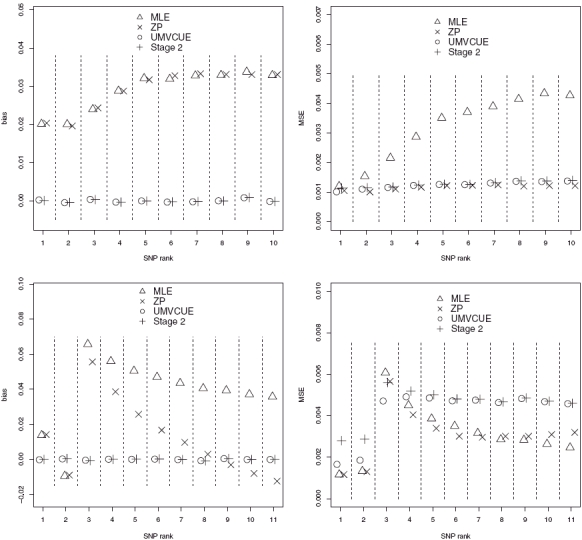
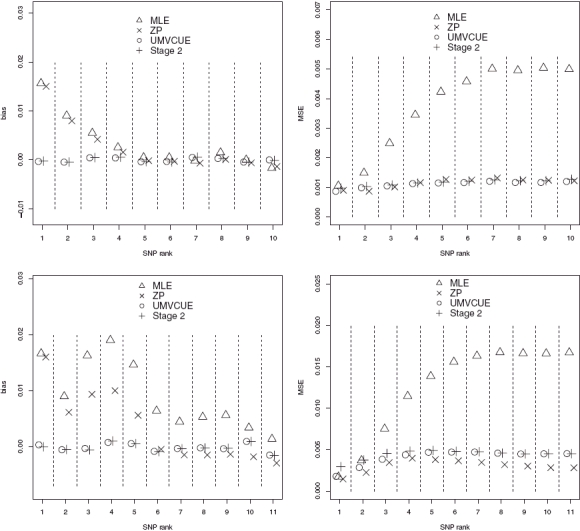
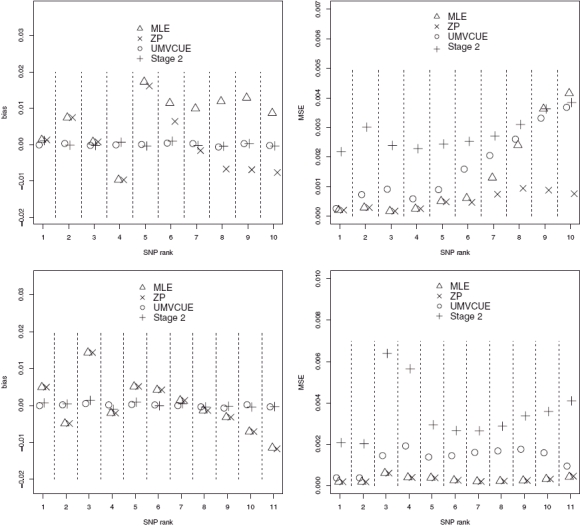
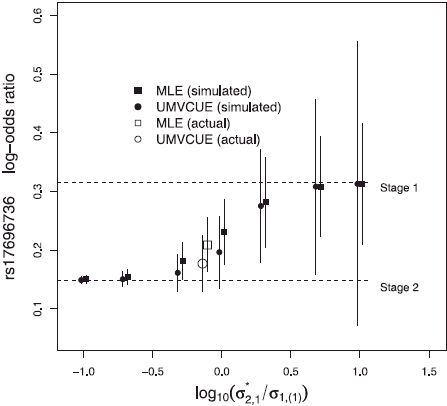
Odds ratios or other effect sizes estimated from genome scans are upwardly biased, because only the top-ranking associations are reported, and moreover only if they reach a defined level of significance. No unbiased estimate exists based on data selected in this fashion, but replication studies are routinely performed that allow unbiased estimation of the effect sizes. Estimation based on replication data alone is inefficient in the sense that the initial scan could, in principle, contribute information on the effect size. We propose an unbiased estimator combining information from both the initial scan and the replication study, which is more efficient than that based just on the replication. Specifically, we adjust the standard combined estimate to allow for selection by rank and significance in the initial scan. Our approach explicitly allows for multiple associations arising from a scan, and is robust to mis-specification of a significance threshold. We require replication data to be available but argue that, in most applications, estimates of effect sizes are only useful when associations have been replicated. We illustrate our approach on some recently completed scans and explore its efficiency by simulation.
2009 Wiley-Liss, Inc.
Figures
References
-
- Bowden J, Glimm E. Unbiased estimation of selected treatment means in two-stage trials. Biometrical J. 2008;50:515–527. - PubMed
-
- Chanock SJ, Manolio T, Boehnke M, Boerwinkle E, Hunter DJ, Thomas G, Hirschhorn JN, Abecasis G, Altshuler D, Bailey-Wilson JE, Brooks LD, Cardon LR, Daly M, Donnelly P, Fraumeni JF, Jr, Freimer NB, Gerhard DS, Gunter C, Guttmacher AE, Guyer MS, Harris EL, Hoh J, Hoover R, Kong CA, Merikangas Kr, Morton CC, Palmer LF, Phimister EG, Rice JP, Robert J, Rotimi C, Tucker Ma, Vogan KJ, Wacholder S, Wijsman EM, Winn DM, Collins FS, NCI-NHGRI Working Group on Replication in Association Studies Replicating genotype–phenotype associations. Nature. 2007;447:655–660. - PubMed
-
- Cohen A, Sackrowitz H. Two stage conditionally unbiased estimators of the selected mean. Stat Probability Lett. 1989;8:273–278.
-
- Copas J. What works? Selectivity models in meta-analysis. J R Stat Soc Ser A. 1999;162:95–109.
-
- Easton DF, Pooley KA, Dunning AM, Pharoah PDP, Thompson D, Ballinger DG, Struewing JP, Morrison J, Field H, Luben R, Wareham N, Ahmed S, Healey CS, Bowman R SEARCH collaborators; Meyer KB, Haiman CA, Kolonel LK, Henderson BE, Le Marchand L, Brennan P, Sangrajrang S, Gaborieau V, Odefrey F, Shen CY, Wu PE, Wang HC, Eccles D, Evans DG, Peto J, Fletcher O, Johnson N, Seal S, Stratton MR, Rahman N, Chenevix-Trench G, Bojesen SE, Nordestgaard BG, Axelsson CK, Garcia-Closas M, Brinton L, Chanock S, Lissowska J, Peplonska B, Nevanlinna H, Pagerholm R, Eerola H, Kang D, Yoo KY, Noh DY, Ahn SH, Hunter DJ, Hankinson SE, Cox DG, Hall P, Wedren S, Liu J, Low YL, Bogdanova N, Schurmann P, Dork T, Tollenaar RA, Jacobi CE, Devilee P, Klijn JG, Sigurdson AJ, Doody MM, Alexander BH, Zhang J, Cox A, Brock IW, MacPherson G, Reed MW, Couch FJ, Goode EL, Olson JE, Meijers-Heijboer H, van den Puweland A, Uitterlinden A, Rivadeneira F, Milne RL, Ribas G, Gonzalez-Neira A, Benitez J, Hopper JL, McCredie MM, Southey M, Giles GG, Schroen C, Justenhoven C, Brauch H, Hamann U, Ko YD, Spurdle AB, Beesley J, Chen X kConFab; AOCS Management Group. Mannermaa A, Kosma VM, Kataja V, Hartikainen J, Day NE, Cox DR, Ponder BA. Genome-wide association study identifies novel breast cancer susceptibility loci. Nature. 2007;447:1087–1093. - PMC - PubMed
Publication types
MeSH terms
Grants and funding
LinkOut - more resources
Full Text Sources
