Transient and etiology-related transcription regulation in cirrhosis prior to hepatocellular carcinoma occurrence
- PMID: 19140229
- PMCID: PMC2653326
- DOI: 10.3748/wjg.15.300
Transient and etiology-related transcription regulation in cirrhosis prior to hepatocellular carcinoma occurrence
Abstract
Aim: To search for transcription dysregulation that could (1) differentiate hepatocellular carcinoma (HCC)-free from HCC-related cirrhosis (2) differentiate HCC-free cirrhosis related to HCV from that related to alcohol intake.
Methods: Using microarray analysis, we compared transcript levels in HCC-free cirrhosis (alcoholism: 7; hepatitis C: 7), HCC-associated cirrhosis (alcoholism: 10; hepatitis C: 10) and eight control livers. The identified transcripts were validated by qRT-PCR in an independent cohort of 45 samples (20 HCC-free cirrhosis; 15 HCC-associated cirrhosis and 10 control livers). We also confirmed our results by immunohistochemistry.
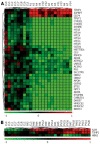
Results: In HCC-free livers, we identified 70 transcripts which differentiated between alcoholic-related cirrhosis, HCV-related cirrhosis and control livers. They mainly corresponded to down-regulation. Dysregulation of Signal Transduction and Activator of Transcription-3 (STAT-3) was found along with related changes in STAT-3 targets which occurred in an etiology-dependent fashion in HCC-free cirrhosis. In contrast, in HCC, such transcription dysregulations were not observed.
Conclusion: We report that transcriptional dysregulations exist in HCC-free cirrhosis, are transiently observed prior to detectable HCC onset and may be appear like markers from cirrhosis to HCC transition.
Figures


Similar articles
-
Genome-wide differences in hepatitis C- vs alcoholism-associated hepatocellular carcinoma.World J Gastroenterol. 2008 Mar 21;14(11):1749-58. doi: 10.3748/wjg.14.1749. World J Gastroenterol. 2008. PMID: 18350606 Free PMC article.
-
Stem cell and hepatocyte proliferation in hepatitis C cirrhosis and hepatocellular carcinoma: transplant implications.Ann Hepatol. 2013 Jan-2014 Feb;13(1):45-53. Ann Hepatol. 2013. PMID: 24378265
-
Hepatic gene expression profiles associated with fibrosis progression and hepatocarcinogenesis in hepatitis C patients.World J Gastroenterol. 2005 Apr 7;11(13):1995-9. doi: 10.3748/wjg.v11.i13.1995. World J Gastroenterol. 2005. PMID: 15800993 Free PMC article.
-
Hepatocellular carcinoma in HCV-infected patients awaiting liver transplantation: genes involved in tumor progression.Liver Transpl. 2004 May;10(5):607-20. doi: 10.1002/lt.20118. Liver Transpl. 2004. PMID: 15108252
-
Molecular Mechanisms Driving Progression of Liver Cirrhosis towards Hepatocellular Carcinoma in Chronic Hepatitis B and C Infections: A Review.Int J Mol Sci. 2019 Mar 18;20(6):1358. doi: 10.3390/ijms20061358. Int J Mol Sci. 2019. PMID: 30889843 Free PMC article. Review.
Cited by
-
Effect of diosmin on apoptotic signaling molecules in N-nitrosodiethylamine-induced hepatocellular carcinoma in experimental rats.Mol Cell Biochem. 2018 Dec;449(1-2):27-37. doi: 10.1007/s11010-018-3339-3. Epub 2018 Feb 26. Mol Cell Biochem. 2018. PMID: 29479636
-
Computational identification of microRNAs and their targets in liver cirrhosis.Oncol Lett. 2017 Dec;14(6):7691-7698. doi: 10.3892/ol.2017.7252. Epub 2017 Oct 23. Oncol Lett. 2017. PMID: 29250171 Free PMC article.
-
Novel serum markers of fibrosis progression for the follow-up of hepatitis C virus-infected patients.Am J Pathol. 2009 Jul;175(1):46-53. doi: 10.2353/ajpath.2009.080850. Epub 2009 May 28. Am J Pathol. 2009. PMID: 19477948 Free PMC article.
-
The protective role of ellagitannins flavonoids pretreatment against N-nitrosodiethylamine induced-hepatocellular carcinoma.Saudi J Biol Sci. 2014 Dec;21(6):589-96. doi: 10.1016/j.sjbs.2014.03.004. Epub 2014 Mar 31. Saudi J Biol Sci. 2014. PMID: 25473368 Free PMC article.
-
Hepatitis C virus infection suppresses the interferon response in the liver of the human hepatocyte chimeric mouse.PLoS One. 2011;6(8):e23856. doi: 10.1371/journal.pone.0023856. Epub 2011 Aug 23. PLoS One. 2011. PMID: 21886832 Free PMC article.
References
-
- Pincock S. Binge drinking on rise in UK and elsewhere. Government report shows increases in alcohol consumption, cirrhosis, and premature deaths. Lancet. 2003;362:1126–1127. - PubMed
-
- Lee JS, Thorgeirsson SS. Comparative and integrative functional genomics of HCC. Oncogene. 2006;25:3801–3809. - PubMed
-
- Thorgeirsson SS, Grisham JW. Molecular pathogenesis of human hepatocellular carcinoma. Nat Genet. 2002;31:339–346. - PubMed
-
- Bruix J, Hessheimer AJ, Forner A, Boix L, Vilana R, Llovet JM. New aspects of diagnosis and therapy of hepatocellular carcinoma. Oncogene. 2006;25:3848–3856. - PubMed
-
- Llovet JM, Wurmbach E. Gene expression profiles in hepatocellular carcinoma: not yet there. J Hepatol. 2004;41:336–339. - PubMed
Publication types
MeSH terms
Substances
LinkOut - more resources
Full Text Sources
Medical
Molecular Biology Databases
Miscellaneous

