. 2009 Mar;108(5):1251-65.
doi: 10.1111/j.1471-4159.2008.05864.x. Epub 2009 Jan 28.

The CREB/CRE transcriptional pathway: protection against oxidative stress-mediated neuronal cell death

Affiliations

The CREB/CRE transcriptional pathway: protection against oxidative stress-mediated neuronal cell death

Boyoung Lee et al. J Neurochem. 2009 Mar.

Abstract

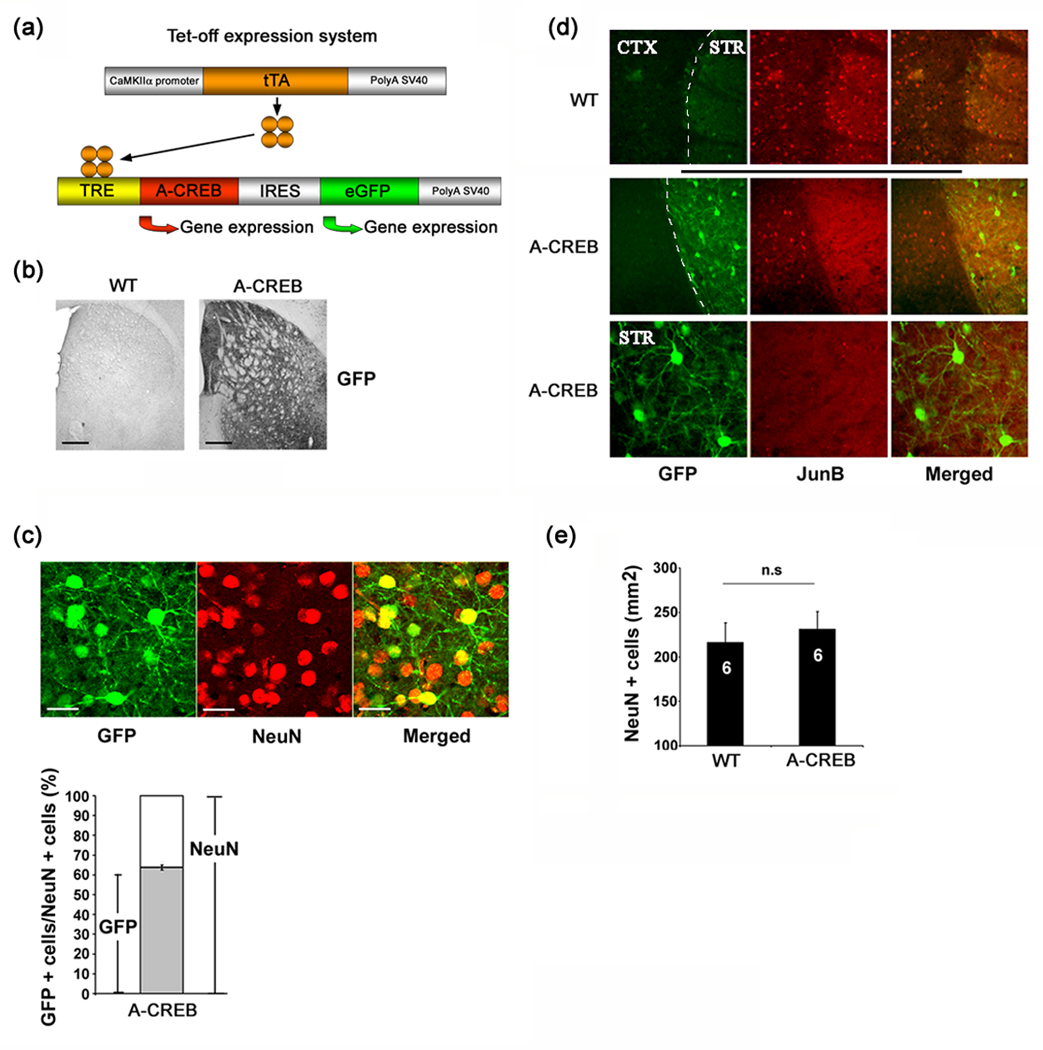
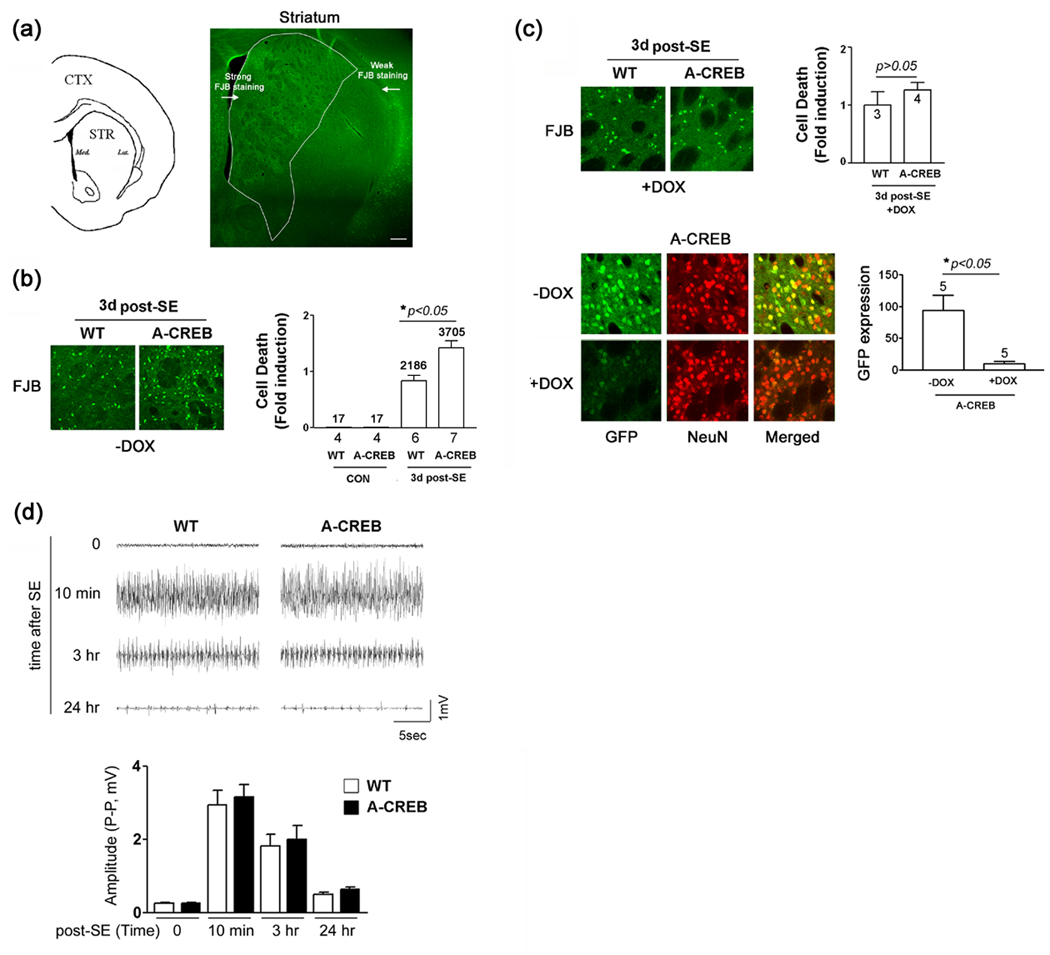
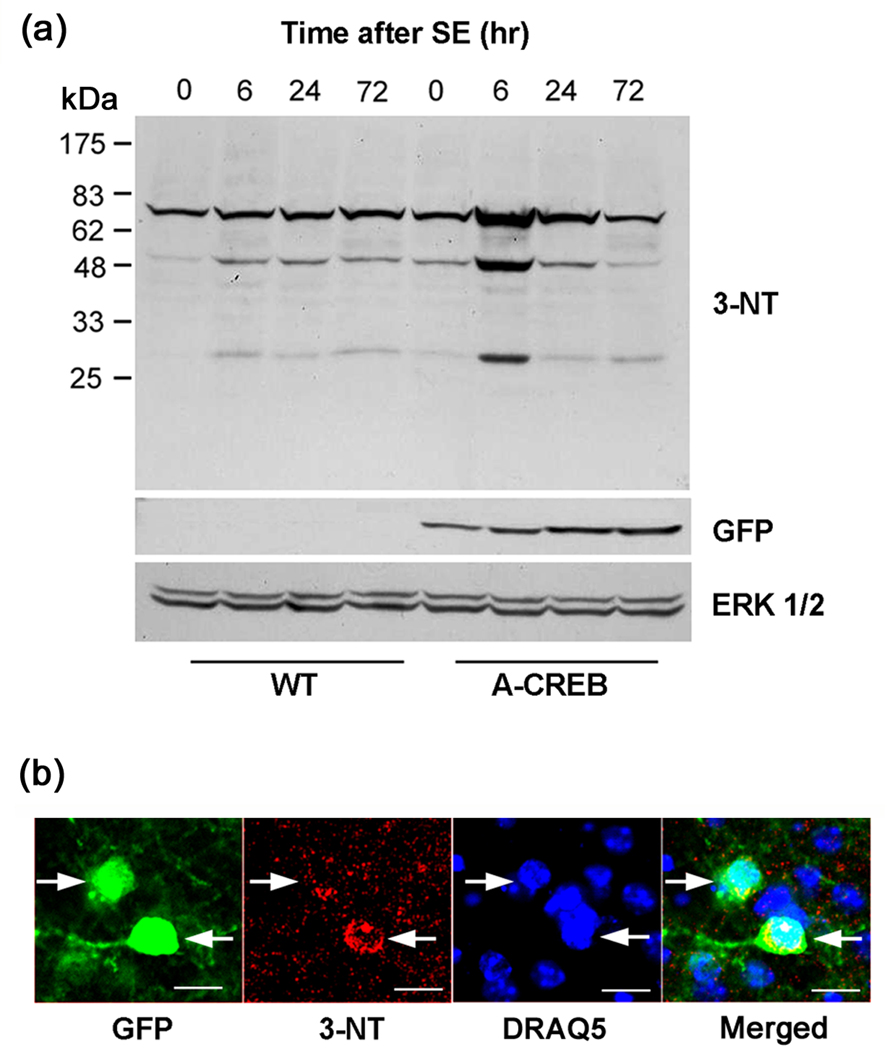
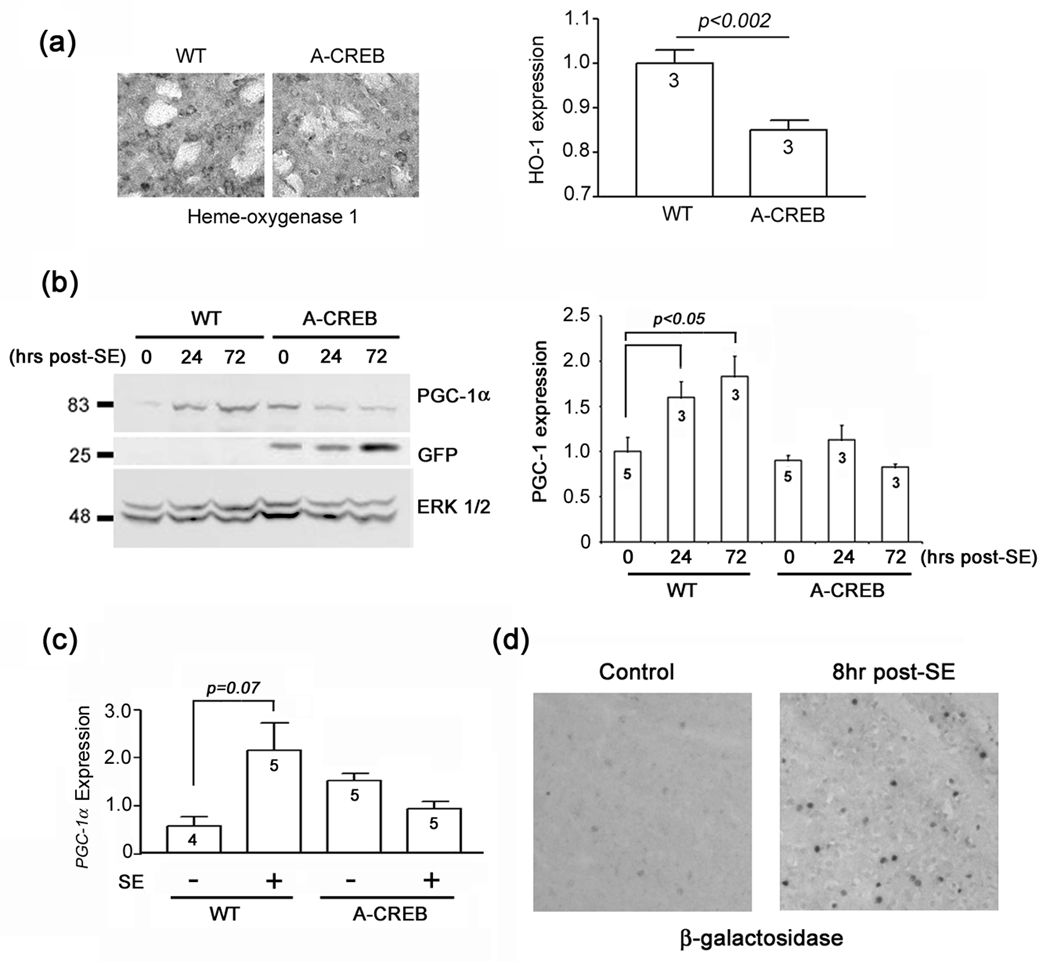
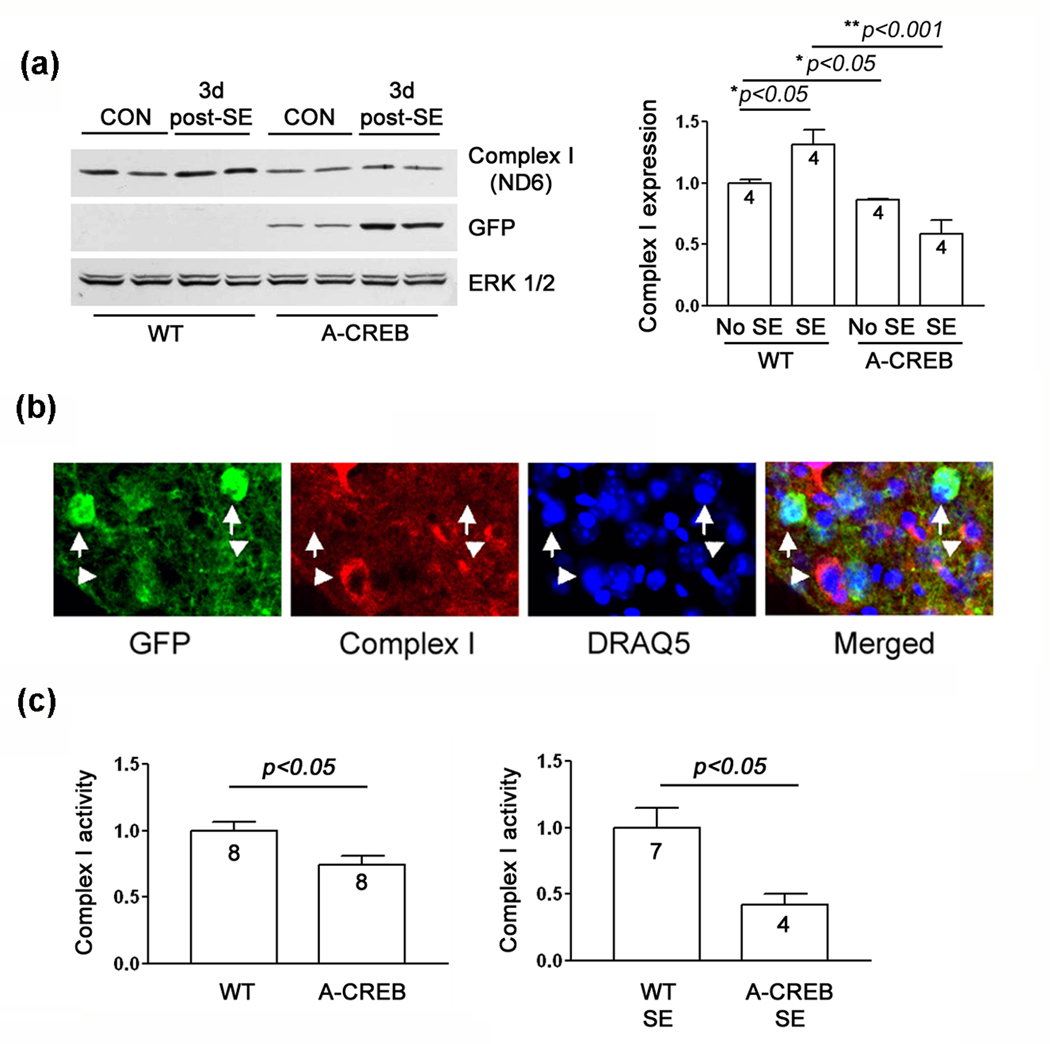
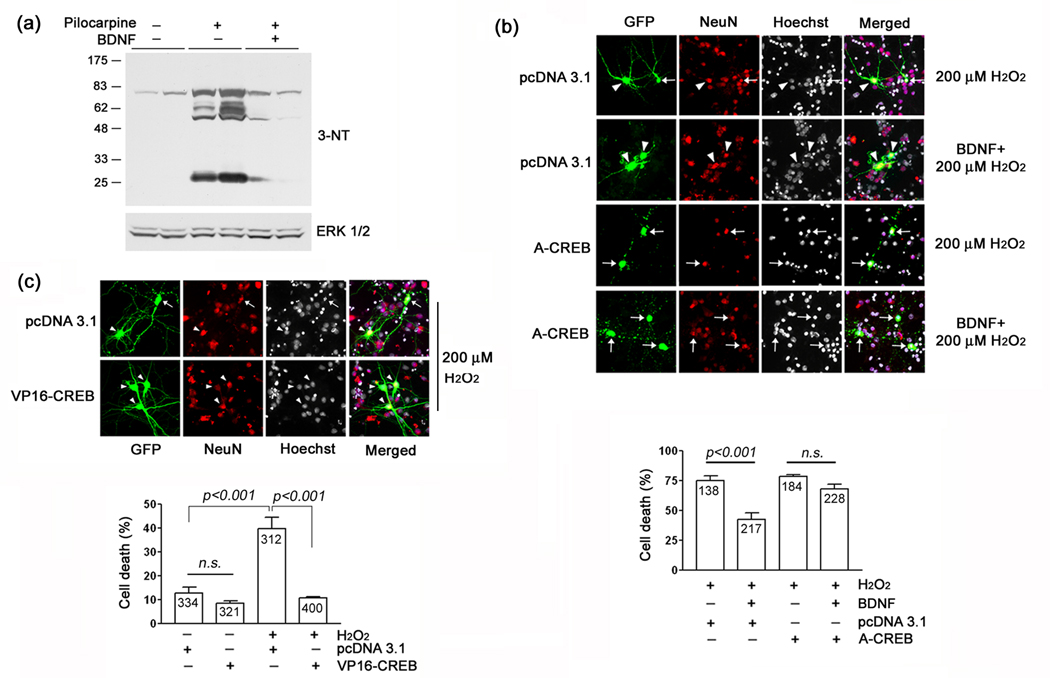
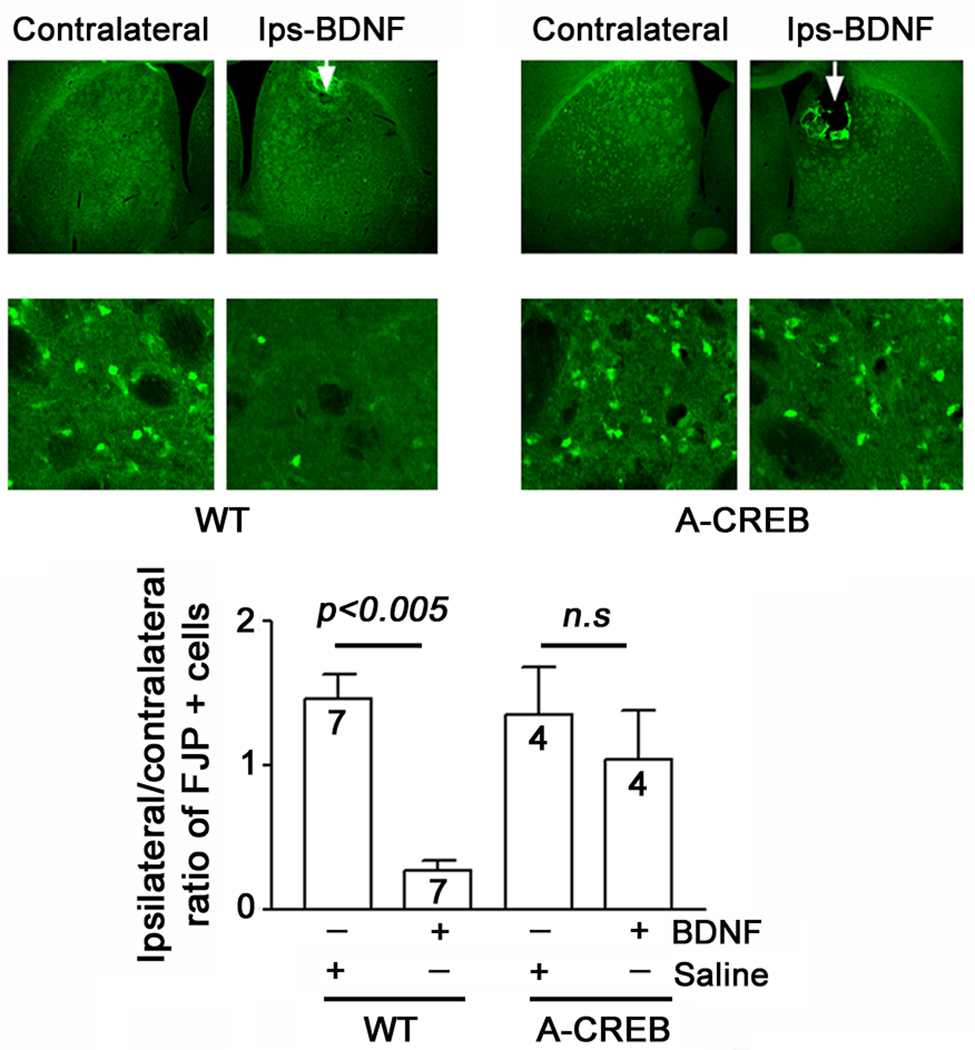
Formation of reactive oxygen and nitrogen species is a precipitating event in an array of neuropathological conditions. In response to excessive reactive oxygen species (ROS) levels, transcriptionally dependent mechanisms drive the up-regulation of ROS scavenging proteins which, in turn, limit the extent of brain damage. Here, we employed a transgenic approach in which cAMP-response element binding protein (CREB)-mediated transcription is repressed (via A-CREB) to examine the contribution of the CREB/cAMP response element pathway to neuroprotection and its potential role in limiting ROS toxicity. Using the pilocarpine-evoked repetitive seizure model, we detected a marked enhancement of cell death in A-CREB transgenic mice. Paralleling this, there was a dramatic increase in tyrosine nitration (a marker of reactive species formation) in A-CREB transgenic mice. In addition, inducible expression of peroxisome proliferator-activated receptor gamma coactivator-1alpha was diminished in A-CREB transgenic mice, as was activity of complex I of the mitochondrial electron transport chain. Finally, the neuroprotective effect of brain-derived neurotrophic factor (BDNF) against ROS-mediated cell death was abrogated by disruption of CREB-mediated transcription. Together, these data both extend our understanding of CREB functionality and provide in vivo validation for a model in which CREB functions as a pivotal upstream integrator of neuroprotective signaling against ROS-mediated cell death.


Figures

Fig. 1
Fig. 1. A-CREB transgenic mice
(a) Schematic of the bitransgenic tet-off system used to drive the expression of A-CREB and the marker GFP. (b) Tissue was immunohistochemically-processed for the transgene maker GFP. Note the robust staining in the striatum. As a test for antibody specificity, tissue from a WT littermate was processed for GFP expression. Bar = 250 µm. (c) Representative GFP (green) and NeuN (red) double labeling in the striatum. Bar = 25 µm. Quantitation of transgenic cell numbers is shown below. Approximately 64% of striatal neurons had detectable levels of GFP expression. Analysis was performed on ~ 1000 striatal cells from five animals. (d) Representative double labeling for the transgene marker GFP and JunB. Animals were killed 90 min after pilocarpine-evoked SE. WT tissue shows marked JunB expression in the striatum (STR) and cortex (CTX). In contrast, in A-CREB transgenic mice, JunB expression was not detected in the striatum, where high levels of the transgene are expressed. Magnified representative double labeling from A-CREB transgenic tissue is shown in the bottom set of panels. (e) Quantitation of NeuN positive cells in wild type (N=6) and A-CREB transgenic (N=6) mice. No significant difference (n.s) in cell density between transgenic and wild type mice was detected. Please see the Methods section for a detailed description of the counting process.
Fig. 2
Fig. 2. Status Epilepticus-induced cell death in the striatum
(a) Left panel) Line drawing denoting the approximate location (anterior/posterior: +1.10 from bregma) of striatal cell counting. Right panel) Representative low magnification image of FJB labeling in the striatum. Status epilepticus (SE) was induced with pilocarpine (325 mg/kg) and FJB labeling was used to detect dead and dying cells at 3 days post-SE. Bright green dots are FJB-positive cells. A higher level of cell death was consistently observed in the medial striatum. Bar = 250 µm. (b) Left panel) Representative images of striatal FJB labeling in WT and A-CREB transgenic mice. Tissue was collected 3 days post-SE. Note the higher relative number of dead cells in the A-CREB transgenic striatum. Right panel) Quantitation of FJB-positive cells in wild type and A-CREB transgenic mice. Under control conditions (no pilocarpine injection), little FJB labeling was detected in transgenic and wild type mice. Values below bars indicate the number of animals analyzed. Numbers above bars indicate the aggregate number of FJB-positive cells counted. SE-induced cell death in WT mice was normalized to a value of 1. Please see the Methods section for a detailed description of the counting procedure. (c) Doxycycline administration attenuates the effects of A-CREB on SE-induced cell death. Top left panel) Representative FJB labeling from WT and A-CREB transgenic mice treated for 2 weeks with doxycycline (1 mg/ml) in the drinking water. Tissue was collected 3 days post-SE. Top right panel) FJB cell death quantitation was performed as described in ‘b’. No significant difference in cellular vulnerability between WT and A-CREB transgenic mice was detected. Numbers in bars denote the number of animals analyzed. Bottom left panel) Representative double labeling of striatal tissue for GFP and NeuN in either the absence of, or following 2 weeks of doxycycline (1 mg/ml) treatment. Bottom right panel) Quantitation of GFP expression in A-CREB transgenic mice that were (Dox +) and were not (Dox −) treated with doxycycline. Values above the bar indicate the number of animals analyzed. GFP expression was analyzed via densitometry and normalized (a value of 100) to the – DOX condition (d) Top) Representative EEG recordings of pilocarpine-evoked seizure activity in a wild-type and A-CREB transgenic mice immediately prior to (time = 0), and at multiple time points following SE onset. Importantly, the EEG patterns of WT and transgenic mice were similar, as was the duration of SE, indicating that A-CREB does not markedly alter the electrophysiological characteristics of the SE episode. Bottom) Measurement of the EEG activity amplitude (peak to peak: P-P) for wild type and A-CREB transgenic mice. There was no significant difference in EEG activity between two lines. Significance was determined using the two-tailed Student's t test. Four wild type and 7 A-CREB mice were used for analysis.
Fig. 3
Fig. 3. SE-induced oxidative stress in A-CREB transgenic mice
(a) Western blot showing increased 3-nitrotyrosine (3-NT) levels as a function of time following SE. Striatal tissue was collected at the noted times and lysates were probed using an antibody against 3-NT. In WT mice, an increase in 3-NT incorporation was noted from 6–72 hrs post-SE. Compared to WT mice, the level of 3-NT incorporation at the 6 hr time point was much higher in A-CREB transgenic mice. The blot was stripped and probed for expression of the GFP transgene, and, as a protein loading control, the blot was also probed ERK 1/2 levels. (b) Triple fluorescence labeling for GFP, 3-NT and DraQ5 in the striatum of A-CREB transgenic mice. The representative image shows that relatively high levels of 3-NT are detected in GFP positive (transgenic) cells (arrows). Tissue was collected at 24 hrs post-SE onset. Bar = 10 µm.
Fig. 4
Fig. 4. CREB regulates HO-1 and PGC-1α expression
(a) Left) Representative photomicrographs of heme oxygenase 1 (HO-1) expression in WT and A-CREB mice under control conditions (no pilocarpine). Right) Quantitation of HO-1 expression. The value for WT mice was normalized to 1; numbers in bars denote the number of animals examined. (b) Western blotting of striatal samples for PGC-1α. Tissue was harvested at 0 hour (control), 24 hours and 3 day after SE onset from both A-CREB and wild type (WT) mice. Left) Representative blot showing that in wild type mice, SE induced a marked increase in PGC-1α expression at 24 hrs and 3 days post-SE. In contrast SE did not evoke PGC-1α in A-CREB transgenic mice. The blot was stripped and probed for expression of the GFP transgene, and the protein loading control, ERK 1/2. Right) Quantitative densitometric analysis of PGC-1α expression. Levels of PGC-1α were normalized to ERK 2 levels for each lane, and averaged across all triplicate determinations; control (no SE) values were normalized to a value of 1. Values in the bar indicate the number of blots analyzed. (c) Sybr Green-based quantitative real time PCR analysis of PGC-1α transcript expression. Animals were sacrificed 24 hrs after SE onset. Relative to WT mice, SE-induced PGC-1α expression was blunted in A-CREB transgenic mice. Data are presented as the relative PGC-1α expression amd averaged using quadruplicate determinations from 4–5 animals for each condition. (d) SE evoked CRE-mediated reporter gene expression in the striatum. Representative photomicrographs of striatal β-galactosidase expression under control conditions and 8 hrs after SE onset. Tissue was processed using DAB labeling with nickel intensification.
Fig. 5
Fig. 5. Mitochondrial complex I expression and activity in A-CREB and WT mice following SE
(a) Left) Western blotting for ND6, a subunit of complex I. In wild type mice, SE induced a modest increase in ND6 expression at 3 days post-SE. In A-CREB transgenic mice, SE did not elevate ND6 levels. In addition, relative to WT mice, a lower level of ND6 expression was detected in A-CREB transgenics. Blots were probed for the transgene marker (GFP) and for total protein levels (ERK 1/2). Two samples were run for each condition. Right) ND6 band intensity was normalized to ERK 2 intensity for each lane; control (no SE) values were normalized to a value of 1. (b) Representative triple labeling for GFP, DraQ5 and ND6 (complex I). The images reveal that transgenic cells have a lower level of ND6 expression than non-transgenic cells. Arrows denote GFP-positive cells. Arrowheads denote GFP-negative cells. (c) Complex I activity. Striatal mitochondria were isolated from A-CREB and WT mice under control conditions and three days after SE. Complex I activity (assayed in the crude mitochondrial preparation) was normalized to a value of 1 for WT mice. Values are presented as the mean ± SEM. The numbers in the bars denotes the number of animals (samples) used for the analysis.
Fig. 6
Fig. 6. BDNF-mediated neuroprotection from oxidative injury: role of CREB
(a) BDNF attenuates seizure-induced tyrosine nitration. Wild type mice were cannulated in the dorsal striatum and infused with vehicle or BDNF (1 µl: 50 ng/µl) 24 hours prior to pilocarpine injection. Mice were killed 6 h after pilocarpine injection and striatal tissue was collected and probed for 3-NT levels as described in Fig. 3. BDNF infusion reduced the seizure-induced increase in 3-NT levels. Each condition was run in duplicate. (b) Top panel) Striatal cells were isolated from embryonic day 18 rat pups, cultured for 7 days and then transfected with the marker gene Venus and either A-CREB or an empty expression vector (pcDNA3.1). Two days later, cell were treated with BDNF (100 ng/µl), followed 24 hrs later by exposed to H2O2 (200 µM, 30 min). Cells were fixed 4 hrs after H2O2 treatment, immunolabeled for Venus and NeuN and cell death was scored via Hoechst labeling. Relative to mock-treated samples, H2O2 led to a pronounced increase in cell death. Pretreatment with BDNF significantly attenuated H2O2 toxicity. Arrows denote dead transfected neurons (e.g., fragmented or condensed nuclei): arrowheads denote live cells. Bottom panel) Quantitative analysis revealed that the neuroprotective effects of BDNF were inhibited by A-CREB. Data are from triplicate determinations. Error bars denote SEM. Numbers in the bars indicate the number of neurons assayed. There was no significant difference (n.s., p>0.05) between the A-CREB transfected groups. (c) Top panel) Cultured striatal neurons were transfected with the marker gene Venus and either VP16-CREB or an empty expression vector (pcDNA 3.1) and stimulated as described above with H2O2. After 30 min stimulation with H2O2, cells were washed with culture media and maintained for eight more hours. Cells were then immunolabeled and scored for cell viability as described above. Representative images reveal that VP16-CREB conferred protection against H2O2-mediated cell death. Arrow indicates dead transfected neurons and arrowheads denote live neurons. Bottom panel) Quantitative analysis of cell death under the different stimulus and transfection conditions. Data are from triplicate determinations. Error bars denote SEM. Numbers in bars indicate the total number of neurons counted. Of note, the elevated level of H2O2-evoked cell death in panel ‘c’ relative to panel ‘d’ is the likely result of the extended withdrawal (24 hrs) of B27 prior to H2O2 treatment, which was required to effectively test the neuroprotective effects of BDNF. Please see the Methods section for additional details of the experimental approach.
Fig. 7
Fig. 7. CREB couples BDNF to neuroprotection following SE
Wild type and A-CREB transgenic mice were cannulated in the dorsal striatum and infused with BDNF (1 µl: 50 ng/ml) or vehicle 24 hours prior to SE induction: mice were killed 3 days after SE. Representative FJB images of the BDNF infused striatum (Ips-BDNF) and the contralateral striatum. Arrows in the low magnification images denote the sites of infusion. High magnification images: note the marked reduction in FJB-positive cells in the BDNF infused hemisphere of the WT animal. In contrast, the neuroprotective effects of BDNF were blunted in the A-CREB transgenic mice. Bottom panel) Quantitative analysis of FJB-positive cells. For each experimental group, the number of FJB-positive cells in the infused striatum was divided by the number of positive cells in the contralateral striatum. These values were averaged across all animals for each group and expressed as the ratio and normalized to a value of 1 for each group. In WT mice, BDNF infusion significantly attenuated cell death relative to the contralateral striatum. In contrast BDNF did not confer significant neuroprotection in A-CREB transgenic mice. A detailed description of the cell quantitation is found in the Methods section. Of note, the higher level of cell death detected in the infused striatum likely results from an additive effect of infusion-induced brain trauma and the SE insult.

References

    1. Ahn S, Olive M, Aggarwal S, Krylov D, Ginty DD, Vinson C. A dominant-negative inhibitor of CREB reveals that it is a general mediator of stimulus-dependent transcription of c-fos. Mol. Cell. Biol. 1998;18:967–977. - PMC - PubMed
    1. Alam J, Cook JL. Transcriptional regulation of the heme oxygenase-1 gene via the stress response element pathway. Curr Pharm Des. 2003;9:2499–2511. - PubMed
    1. Albers DS, Beal MF. Mitochondrial dysfunction and oxidative stress in aging and neurodegenerative disease. J. Neural. Transm. Suppl. 2000;59:133–154. - PubMed
    1. Applied Biosystems. Essentials of Real Time PCR. 2003
    1. Aracena P, Aguirre P, Muñoz P, Núñez MT. Iron and glutathione at the crossroad of redox metabolism in neurons. Biol. Res. 2006;39:157–165. - PubMed

Publication types

MeSH terms