Comparative Study
. 2009 Feb;19(2):234-42.
doi: 10.1101/gr.084038.108. Epub 2009 Jan 13.

Network-level molecular evolutionary analysis of the insulin/TOR signal transduction pathway across 12 Drosophila genomes

Affiliations
Comparative Study

Network-level molecular evolutionary analysis of the insulin/TOR signal transduction pathway across 12 Drosophila genomes

David Alvarez-Ponce et al. Genome Res. 2009 Feb.

Abstract

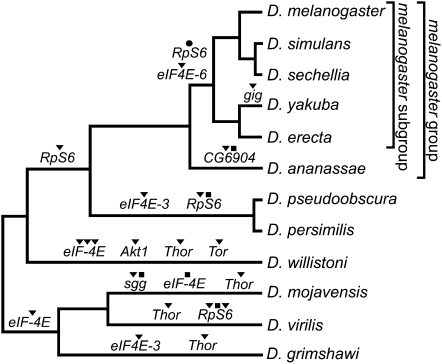
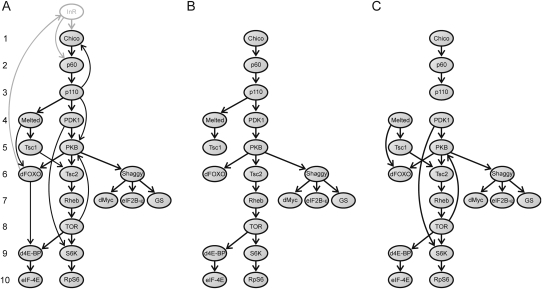
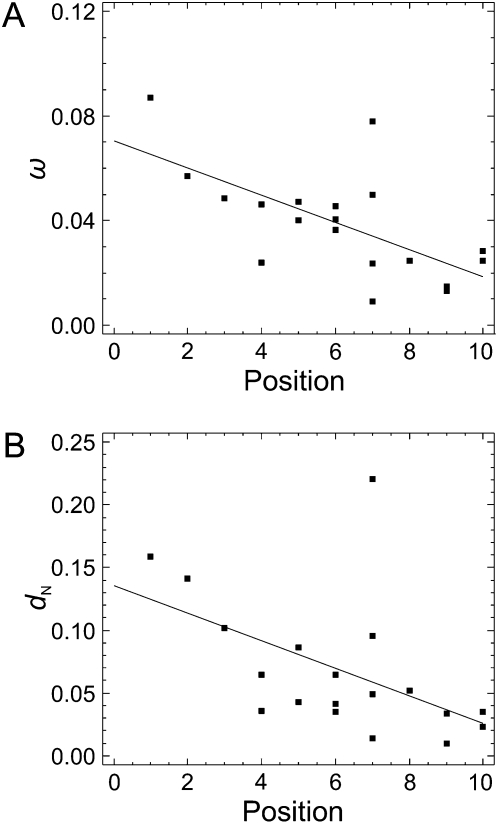
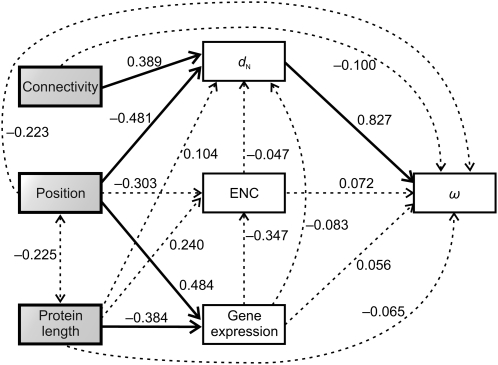
Biological function is based on complex networks consisting of large numbers of interacting molecules. The evolutionary properties of molecular networks and, in particular, the impact of network architecture on the sequence evolution of its individual components are, nonetheless, still poorly understood. Here, we conducted a fine-scale network-level molecular evolutionary analysis of the insulin/TOR pathway across 12 species of Drosophila. We found that the insulin/TOR pathway components are completely conserved across these species and that two genes located at major network branch points show evidence for positive selection. Remarkably, we detected a gradient in the strength of purifying selection along the pathway, increasing from the upstream to the downstream genes. We also found that physically interacting proteins tend to have more similar levels of selective constraint, even though this feature might represent a byproduct of the correlation between selective constraint and the pathway position. Our results clearly indicate that the levels of functional constraint do depend on the position of the proteins in the pathway and, consequently, the architecture of the pathway constrains gene sequence evolution.


Figures

Figure 1.
Figure 1.
Gene duplication (▼), loss (●), and pseudogenization (■) events detected in the IT pathway across the Drosophila phylogeny.
Figure 2.
Figure 2.
Graphs used in the network-level analysis. (A) Directed graph (G graph) representing the interactions across the D. melanogaster IT pathway elements. Arrows (arcs) indicate the direction of signal transduction. Numbers on the left represent the position of the elements in the pathway. (B) Graph T is a directed spanning tree of G used to compute the position of each element in the IT pathway (i.e., the number of signal transduction steps required to transduce the signal from InR to the downstream elements of the pathway). This graph was obtained by removing some arcs from G (according to specific biochemical criteria). We eliminated the three arcs involving feedback loops (activation of Chico by PIP3, which is synthesized by p110; activation of InR by the transcription factor dFOXO; phosphorylation of PKB by TOR). Furthermore, if a particular node is reached by different paths (d4E-BP, dFOXO, PKB, S6K, and Tsc2) we considered only one of them. For dFOXO, PKB, and S6K, we chose the longest path, since each of the paths allows the transduction of one necessary but not sufficient signal for the activation/inhibition of these proteins (i.e., the elements need to receive all the signals for activation/inhibition). Indeed, the recruitment of dFOXO to the cell membrane by Melt is a prior step to the phosphorylation (and consequent inhibition) of dFOXO by PKB (the Akt1 product). In the same way, the recruitment of PKB to the cell membrane through its interaction with PIP3 (synthesized by p110) is also a prior step to the phosphorylation of PKB by PDK1 (the Pk61C product). S6K needs to be phosphorylated by both PDK1 and TOR for full activation (Chou and Blenis 1995; Dufner and Thomas 1999; Avruch et al. 2001). d4E-BP (the Thor encoded protein) is an inhibitor of the pathway activated by its transcription factor dFOXO and inhibited by the TOR kinase. Given that only the second interaction activates the pathway, we eliminated the first from the analysis. (C) Graph S is a subgraph of G that includes only the direct physical PPIs between the elements of the IT pathway.
Figure 3.
Figure 3.
Correlation between the position of the elements in the IT pathway and the ω (A) and dN (B) estimates. Continuous lines represent regression lines.
Figure 4.
Figure 4.
Path analysis used to characterize the relationships among element positions in the IT pathway, nonsynonymous divergence (dN), dN/dS ratio (ω), gene expression level, codon bias (measured by the ENC), protein length, and connectivity. Pathway position, protein length, and connectivity were treated as exogenous variables (those with no explicit causes in the model), while the rest were treated as endogenous variables (those caused by one or more variables in the model). The causal dependencies between variables assumed in the model are represented by single-headed arrows. Correlations between exogenous variables are represented by double-headed arrows. The numbers on the arrows represent the standardized path coefficients (β). Solid and broken lines represent significant and nonsignificant relationships, respectively.
Figure 5.
Figure 5.
Schematic representation of the selective constraint levels expected along two hypothetical signaling pathways with different connection patterns. (A) Pathway receiving multiple signaling inputs along the pathway and with a single output. In this scenario, selective constraint levels will be higher at the downstream part, since the elements are progressively involved in a greater number of pathways. (B) Pathway with multiple outputs along the pathway (i.e., with multiple branching points able to transmit information to other pathways). In this scenario, the selective constraint levels will be higher for the upstream elements. The more constrained elements (nodes) are darker. The numbers in the nodes represent the number of pathways in which each element is involved.

References

    1. Adams M.D., Celniker S.E., Holt R.A., Evans C.A., Gocayne J.D., Amanatides P.G., Scherer S.E., Li P.W., Hoskins R.A., Galle R.F., et al. The genome sequence of Drosophila melanogaster . Science. 2000;287:2185–2195. - PubMed
    1. Avruch J., Belham C., Weng Q., Hara K., Yonezawa K. The p70 S6 kinase integrates nutrient and growth signals to control translational capacity. Prog. Mol. Subcell. Biol. 2001;26:115–154. - PubMed
    1. Begun D.J., Holloway A.K., Stevens K., Hillier L.W., Poh Y.P., Hahn M.W., Nista P.M., Jones C.D., Kern A.D., Dewey C.N., et al. Population genomics: Whole-genome analysis of polymorphism and divergence in Drosophila simulans . PLoS Biol. 2007;5:e310. doi: 10.1371/journal.pbio.0050310. - DOI - PMC - PubMed
    1. Benjamini Y., Hochberg Y. Controlling the false discovery rate: A practical and powerful approach to multiple testing. J. R. Statist. Soc. B. 1995;57:289–300.
    1. Castresana J. Selection of conserved blocks from multiple alignments for their use in phylogenetic analysis. Mol. Biol. Evol. 2000;17:540–552. - PubMed

Publication types

LinkOut - more resources