

Monte Carlo modeling of a 6 and 18 MV Varian Clinac medical accelerator for in-field and out-of-field dose calculations: development and validation
- PMID: 19141879
- PMCID: PMC3376900
- DOI: 10.1088/0031-9155/54/4/N01
Monte Carlo modeling of a 6 and 18 MV Varian Clinac medical accelerator for in-field and out-of-field dose calculations: development and validation
Abstract
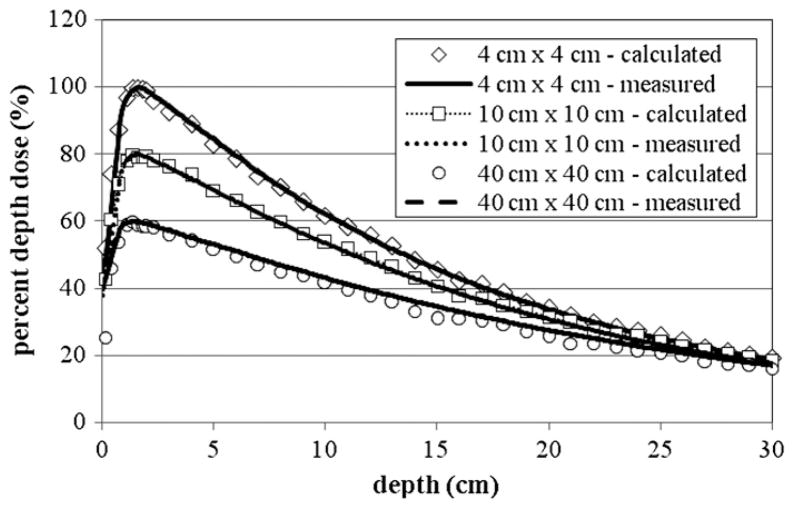
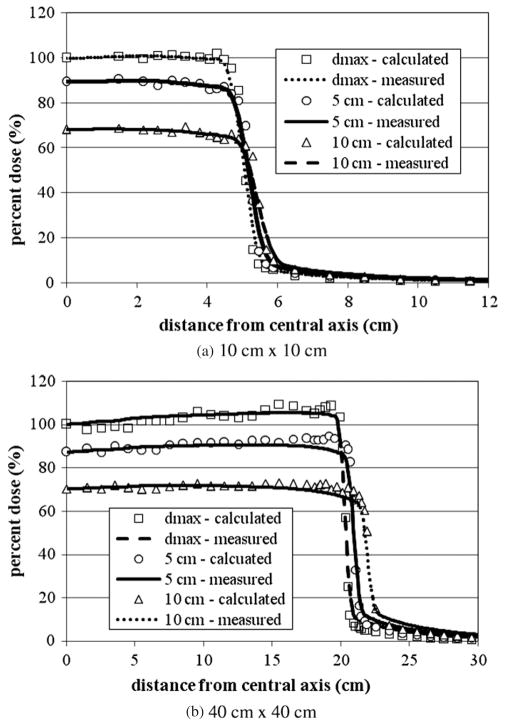
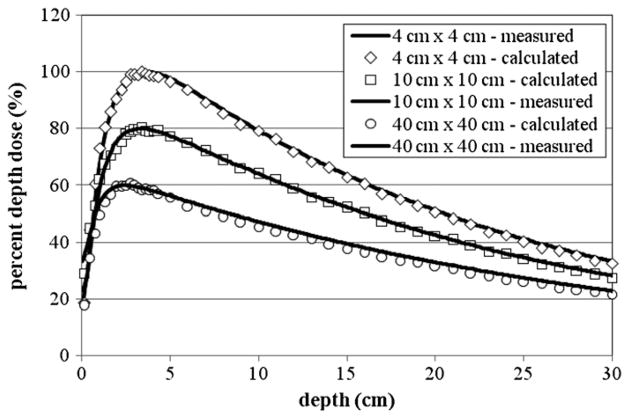
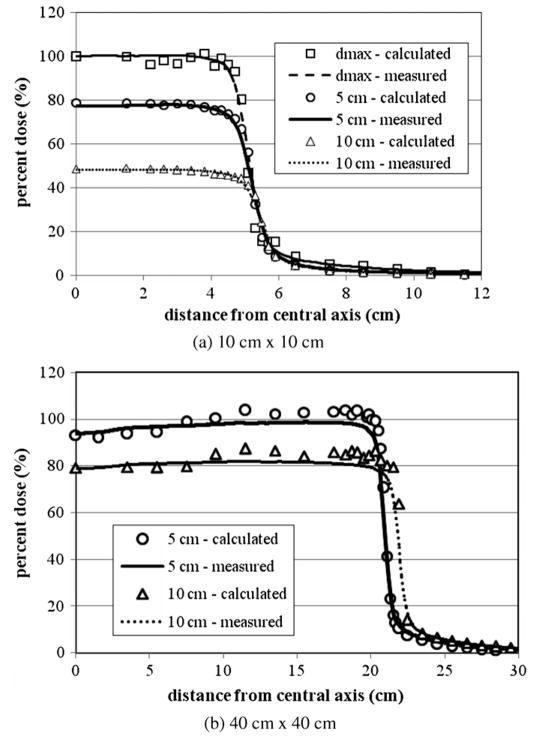
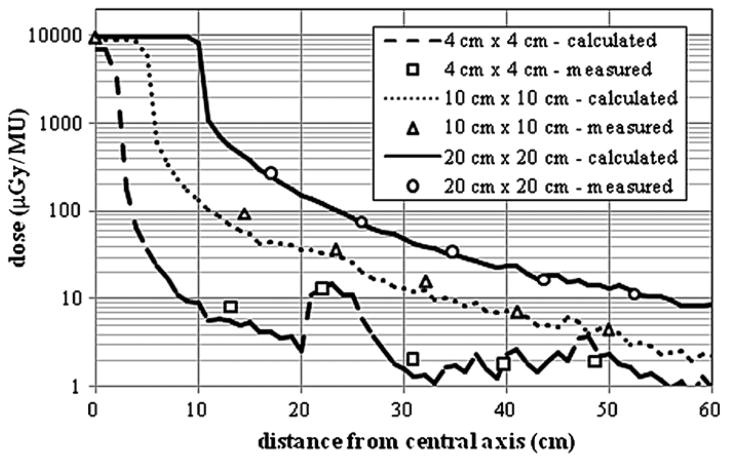
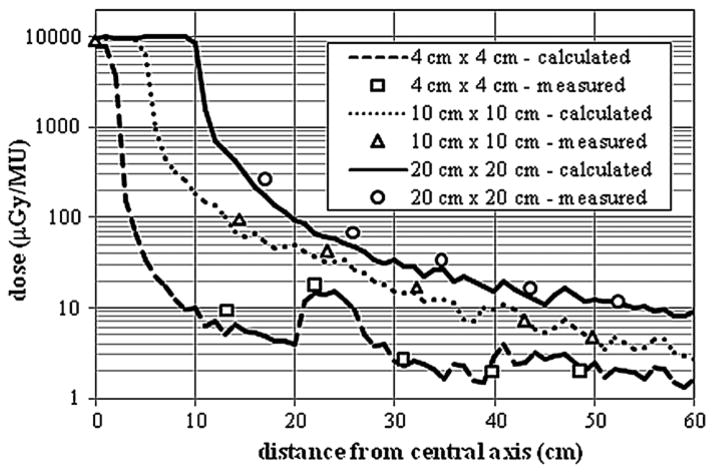
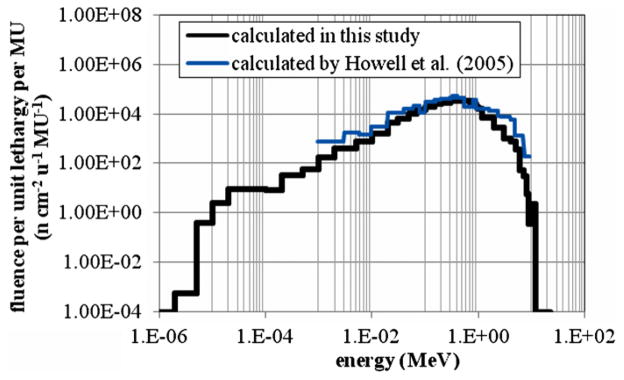
There is a serious and growing concern about the increased risk of radiation-induced second cancers and late tissue injuries associated with radiation treatment. To better understand and to more accurately quantify non-target organ doses due to scatter and leakage radiation from medical accelerators, a detailed Monte Carlo model of the medical linear accelerator is needed. This paper describes the development and validation of a detailed accelerator model of the Varian Clinac operating at 6 and 18 MV beam energies. Over 100 accelerator components have been defined and integrated using the Monte Carlo code MCNPX. A series of in-field and out-of-field dose validation studies were performed. In-field dose distributions calculated using the accelerator models were tuned to match measurement data that are considered the de facto 'gold standard' for the Varian Clinac accelerator provided by the manufacturer. Field sizes of 4 cm x 4 cm, 10 cm x 10 cm, 20 cm x 20 cm and 40 cm x 40 cm were considered. The local difference between calculated and measured dose on the percent depth dose curve was less than 2% for all locations. The local difference between calculated and measured dose on the dose profile curve was less than 2% in the plateau region and less than 2 mm in the penumbra region for all locations. Out-of-field dose profiles were calculated and compared to measurement data for both beam energies for field sizes of 4 cm x 4 cm, 10 cm x 10 cm and 20 cm x 20 cm. For all field sizes considered in this study, the average local difference between calculated and measured dose for the 6 and 18 MV beams was 14 and 16%, respectively. In addition, a method for determining neutron contamination in the 18 MV operating model was validated by comparing calculated in-air neutron fluence with reported calculations and measurements. The average difference between calculated and measured neutron fluence was 20%. As one of the most detailed accelerator models for both in-field and out-of-field dose calculations, the model will be combined with anatomically realistic computational patient phantoms into a computational framework to calculate non-target organ doses to patients from various radiation treatment plans.
Figures
References
-
- Bednarz B. PhD Dissertation. Rensselaer Polytechnic Institute; New York: 2008. Detailed Varian Clinac accelerator modeling for calculating intermediate- and low-level non-target organ doses from radiation treatments.
-
- Brenner DJ, Curtis RE, Hall EJ, Ron E. Second malignancies in prostate carcinoma patients after radiotherapy compared with surgery. Cancer. 2000;88:398–406. - PubMed
-
- Chetty I, et al. Report of the AAPM Task Group No. 105: issues associated with clinical implementation of Monte Carlo-based photon and electron external beam treatment planning. Med Phys. 2007;34:4818–53. - PubMed
-
- Cho SH, et al. Reference photon dosimetry data and reference phase space data for the 6-MV photon beam from Varian Clinac 2100 series linear accelerators. Med Phys. 2005;32:137–48. - PubMed
Publication types
MeSH terms
Grants and funding
LinkOut - more resources
Full Text Sources
Research Materials