. 2009 Mar;17(3):524-37.
doi: 10.1038/mt.2008.284. Epub 2009 Jan 13.

Striatal readministration of rAAV vectors reveals an immune response against AAV2 capsids that can be circumvented

Affiliations

Striatal readministration of rAAV vectors reveals an immune response against AAV2 capsids that can be circumvented

Carmen S Peden et al. Mol Ther. 2009 Mar.

Abstract

Recombinant adeno-associated virus (rAAV) expresses no viral genes after transduction. In addition, because the brain is relatively immunoprivileged, intracranial rAAV transduction may be immunologically benign due to a lack of antigen presentation. However, preexposure to AAV allows neutralizing antibodies (nAbs) to block brain transduction and rAAV readministration in the brain leads to an inflammatory response in the second-injection site. In this study, we replicate our striatal rAAV2/2-GDNF readministration results and extend this effect to a second transgene, green fluorescent protein (GFP). Unlike rAAV2/2-GDNF readministration, striatal rAAV2/2-GFP readministration leads to a loss of transgene in the second site in the absence of detectable circulating nAbs. In order to determine whether the transgene or the AAV2 capsid is the antigenic stimulus in brain for the immune response in the second site, we readministered rAAV2/2-GFP using two different rAAV serotypes (rAAV2/2 followed by rAAV2/5). In this case, there was no striatal inflammation or transgene loss detected in the second-injection site. In addition, striatal readministration of rAAV2/5-GFP also resulted in no detectable immune response. Furthermore, delaying rAAV2/2 striatal readministration to a 11-week interval abrogated the immune response in the second-injection site. Finally, while striatal readministration of rAAV2/2 leads to significant loss of transgene in the second-injection site, this effect is not due to loss of vector genomes as determined by quantitative real-time PCR. We conclude that intracellular processing of AAV capsids after transduction is the immunogenic antigen and capsid serotypes that are processed more quickly than rAAV2/2 are less immunogenic.


Figures
<b>Figure 1</b>
Figure 1
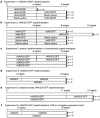
Experimental design. The timing and experimental groups are schematically represented for each experiment in this study. The number of subjects is indicated for each treatment group at the right of their treatment regimen schematic. (a) Experiment 1: rAAV2/2 GDNF readministration. Animals were divided into surgical groups and received injections of rAAV2/2-GDNF or sterile saline in the right striatum. After 4 weeks, the first group of animals was processed for either enzyme-linked immunosorbant assay (ELISA) or histological evaluation. The remaining groups received additional injections of rAAV2/2-GDNF or sterile saline in the left striatum and were processed for ELISA or histological evaluation at the end of 8 weeks. (b) Experiment 2: rAAV2/2-GFP readministration experiment. Animals were divided into surgical groups and received injections of rAAV2/2-GFP or sterile saline in the right striatum. After 4 weeks, the first group was processed for stereological cell counting and histological evaluation. The remaining groups received additional injections of rAAV2/2-GFP or sterile saline control injections in the left striatum and were processed for stereologic cell counting or histological evaluation at the end of 8 weeks, excepting one readministration group that was maintained for a total of 12 weeks to control for time of expression. (c) Experiment 3: striatal readministration of mismatched capsid serotypes (rAAV2/2 versus rAAV2/5). (d) Experiment 4: rAAV2/5 readministration. (e) Experiment 5: delayed rAAV/2/2 readministration. (f) Experiment 6: rAAV2/2 readministration: CMI or transgene expression loss? CMI, cell-mediated immunity; GDNF, glial cell line–derived neurotrophic factor; rAAV2/2, recombinant adeno-associated virus 2/2.
<b>Figure 2</b>
Figure 2
Intrastriatal glial cell line–derived neurotrophic factor (GDNF) expression as determined by enzyme-linked immunosorbant assay (ELISA) and immunohistochemistry. (a) ELISA quantification of GDNF protein in right and left striata of the four treatment groups. Groups were initially injected with 2 µl rAAV2/2-GDNF or sterile saline as a control in the right striatum and after 4 weeks received an additional injection of either 2 µl rAAV2/2-GDNF or sterile saline in the left striatum. Each side from animals that received two administrations of recombinant adeno-associated virus (rAAV) produced levels of GDNF similar to those animals that received only one administration of rAAV. (b) Striatal tissue sections immunostained using antibody to human GDNF. Bar = 500 µm. The first and second injection sides of the readministered animals (rAAV2/2-GDNF readministration) are completely filled with secreted GDNF, confirming the high levels of GDNF detected by ELISA. In contrast, the identically treated saline-injected side of the control animals (rAAV2/2-GDNF alone) has no staining visible for GDNF. The left side of each of the brains (rAAV2/2-GDNF readministration 2nd injection and rAAV2/2-GDNF alone 2nd injection) was cut with a razor blade prior to sectioning to enable orientation of the slices, and is not associated with toxicity or related to the intervention.
<b>Figure 3</b>
Figure 3
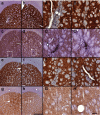
Striatal sections immunostained using antibody to glial fibrillary acidic protein (GFAP). GFAP is normally produced by astrocytes in response to perturbation and inflammation. Bar in d = 500 µm and applies to a–c. Bar in D = 250 µm and applies to A–D which depict a fourfold increase in magnification of the corresponding injections indicated by the boxed area in panels a–d. (a,b) An animal that received rAAV2-GDNF injection in right striatum (a), followed by second administration of rAAV2-GDNF in left striatum 4 weeks later (b). (c,d) An animal that received rAAV2-GDNF injection in right striatum (c), followed by second administration of sterile saline in left striatum 4 weeks later (d). (a) Reactivity in the first-injection side of rAAV2/2-GDNF readministration treatment group and the rAAV2/2-GDNF-alone control group (c) are comparable, and are slightly more pronounced than the second-injection side of the treatment group (b). (d) The saline injection area of the rAAV2/2-GDNF-alone control group exhibits minimal GFAP immunoreactivity. The left side of each of the brains (b,d) was cut with a razor blade prior to sectioning to enable orientation of the slices, and is not associated with toxicity or related to the intervention. Striatal sections immunostained using antibody to OX-42. OX-42 is a marker normally upregulated on activated microglia and macrophages. Bar in h = 500 µm and applies to e–g. Bar in H = 250 µm and applies to E–G that depict a fourfold increase in magnification of the corresponding injections indicated by the boxed area in panels e–h. (e–f) An animal that received rAAV2-GDNF injection in right striatum (e), followed by second administration of rAAV2/2-GDNF in left striatum 4 weeks later (f). (g,h) An animal that received rAAV2-GDNF injection in right striatum (g), followed by second administration of sterile saline in left striatum 4 weeks later (h). (h) Reactivity in the first injection side of the rAAV2/2-GDNF readministration treatment group appears more pronounced than in the first injection side of the rAAV2/2-GDNF alone control group, (g) and the second injection side of the treatment group (f); however, this slice was slightly closer to the actual site of injection. (h) The saline injection area of the rAAV2/2-GDNF-alone control group exhibits minimal OX-42 immunoreactivity. The left side of each of the brains (f,h) was cut with a razor blade prior to sectioning to enable orientation of the slices, and is not associated with toxicity or related to the intervention. Striatal sections immunostained with antibody to RTA-1. RTA-1 is a marker of the rat major histocompatibility complex class 1 complex normally upregulated in virally infected cells. Bar in l = 500 µm and applies to i–k. Bar in L = 250 µm and applies to I,J that depict a fourfold increase in magnification of the corresponding injections indicated by the boxed area in panels i–l. (i,j) An animal that received rAAV2-GDNF injection in right striatum (i), followed by second administration of rAAV2-GDNF in left striatum 4 weeks later (j). (k,l) An animal that received rAAV2-GDNF injection in right striatum (k), followed by second administration of sterile saline in left striatum 4 weeks later (l). (i) Reactivity in the first-injection side of the rAAV2/2-GDNF readministration treatment group and the rAAV2/2-GDNF-alone control group (k) are comparable. While the second-injection side of the treatment group (j) and the saline injection area of the control animal (l) exhibit almost no RTA-1 immunoreactivity. The left side of each of the brains (j,l) was cut with a razor blade prior to sectioning to enable orientation of the slices and is not associated with toxicity or related to the intervention. GDNF, glial cell line–derived neurotrophic factor; rAAV2/2, recombinant adeno-associated virus 2/2.
<b>Figure 4</b>
Figure 4
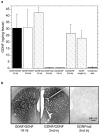
Intrastriatal green fluorescent protein (GFP) expression as estimated by unbiased stereological cell sampling. (a) Mean estimated GFP+ striatal neurons per group. Stereological cell counting and unbiased estimation parameters were used to determine the extent of rAAV2/2-GFP-mediated transduction in the right and left striata of the treated and control animals. There were less striatal GFP+ neurons in the second-injection site when comparing within animals, i.e., GFP/GFP first injection versus GFP/GFP second injection with 8-week total survival (solid gray bar versus white hatched bar *P = 0.0005 and long-term experiment; 12-week survival; solid black bar versus gray hatched bar, P = 0.01). When comparing the GFP+ neuron number in the short-term control group to the readministered striatum with matched survival timed single injection [i.e., phosphate-buffered saline (PBS)/GFP second injection; white solid bar versus GFP/GFP second-injection white hatched bar, 4-week survival; there is not a significant difference, XP = 0.09]. However, there was a significant reduction of striatal GFP+ neurons when comparing readministered animals to single-injected animals that both survived 8 weeks (GFP/GFP second injection, long-term experiment, gray hatched bar versus GFP/PBS first injection, solid gray bar just to the right of the gray hatched bar, P = 0.0004). (b) Neutralizing antibody titers for rAAV2/2-GDNF readministration. Individual animal serum samples were serially diluted and incubated with a standard amount of rAAV2/2 expressing GFP. GFP fluorescence intensity was quantified 28 hours after transduction in HeLa cells. Pretreatment sera served as the control for each animal. nAb titers are expressed as the reciprocal of the serum dilution required to exceed 50% GFP expression of identically diluted control serum. The first panel demonstrates the nAb titers quantified in the glial cell line–derived neurotrophic factor (GDNF) readministration study. The presurgical baseline titers had a median titer of 50 (the lowest level of detection). Postsurgical titers for all the groups were similar to the presurgical titers with the median titer remaining unchanged at 50. (c) Neutralizing antibody titers for rAAV2/2-GFP readministration. The presurgical baseline titers also had a median titer of 50. The postsurgical titers for all the groups were again similar to the presurgical titers with the median titer remaining unchanged at 50. One animal in the readministration group developed a moderate nAb titer after the second vector administration (3,200) and, at this level, was considered to be immunized with a fourfold increase in titer being the minimum criterion for seroconversion. rAAV2/2, recombinant adeno-associated virus 2/2.
<b>Figure 5</b>
Figure 5
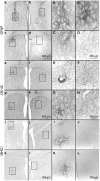
Striatal sections immunostained for glial fibrillary acidic protein (GFAP). The dark reaction product is GFAP, a specific marker for reactive astrocytes that are normally activated in response to inflammation. Bar in h = 500 µm and applies to a–h. Bar in H = 50 µm and applies to A–H that depict a fivefold increase in magnification of the corresponding boxed areas in a–h. Note that the panels on the left side of the figure are from the right side of the brain to depict the order of administration from left to right. (a,b) An animal that received rAAV2-GFP injection in right striatum (a), followed by second administration of rAAV2-GFP in left striatum 4 weeks later (b). Significant reactive astrocytosis is seen in the first- and second-injection site and radiates rostrocaudally from the area of the injection (data not shown). (c,d) An animal that received rAAV2-GFP injection in right striatum (c), followed by second administration of rAAV2-GFP in left striatum 4 weeks later (d). This animal was killed 8 weeks after the second injection. Heightened inflammation persists at the first-injection site (c), and is less pronounced in the area of the second injection (d). Similar to the pattern seen in a and b, the astrocytosis extends rostrocaudally from the area of injection (data not shown). (e,f) An animal that received rAAV2-GFP injection in right striatum (e), followed by second administration of sterile saline in left striatum 4 weeks later (f). The first-injection site (e) reveals astrocytosis in the area of the needle tract in a much more robust pattern than that seen on the saline-injection side (f). In contrast to the readministration groups, this inflammatory response is strictly localized to the needle tract. (g,h) An animal that received a sterile saline injection in right striatum (g), followed by second administration of sterile saline in left striatum 4 weeks later (h). In both the first-injection site (g), and the second-injection site (h), the needle tract is barely visible and no reactive astrocytosis is notable. No sections of the single-injection animals are depicted here, but all of the animals had staining similar to the saline injections pictured in g and h. GFP, green fluorescent protein; rAAV2/2, recombinant adeno-associated virus 2/2.
<b>Figure 6</b>
Figure 6
Striatal sections immunostained for activated microglia (OX-42). The dark reaction product is OX-42, a specific marker for activated microglia and macrophages observed in response to inflammation. Bar in h = 500 µm and applies to a–h. Bar in H = 50 µm and applies to A–H which depict a fivefold increase in magnification of the corresponding boxed areas in a–h. (a,b) An animal that received rAAV2-GFP injection in right striatum (a), followed by second administration of rAAV2-GFP in left striatum 4 weeks later (b). Reactive microgliosis is seen in both hemispheres in readministered animals predominantly in the area of the injection (a,b). The second-injection site appears to have increased activation relative to the first-injection site which may be a result of the time of observation. (c,d) An animal that received rAAV2-GFP injection in right striatum (c), followed by second administration of rAAV2-GFP in left striatum 4 weeks later (d). This animal was killed 8 weeks after the second injection. Microglial scarring now prevails in the first-injected hemisphere in the readministered animals (c), while the second-injection site (d) has less microgliosis as compared to 4 weeks earlier (b). (e,f) An animal that received rAAV2-GFP injection in right striatum (e), followed by second administration of sterile saline in left striatum 4 weeks later (f). Reactive microgliosis, in this case, is limited to the needle tract, and is minimal. (g,h) An animal that received a sterile saline injection in right striatum (g), followed by second administration of sterile saline in left striatum 4 weeks later (h). In both the first-injection site (g), and the second-injection site (h), the needle tract is barely visible and minimal microgliosis is detectable. No sections of the single-injection animals are depicted here, but all of the animals had staining similar to the saline injections pictured in g and h. GFP, green fluorescent protein; rAAV2/2, recombinant adeno-associated virus 2/2.
<b>Figure 7</b>
Figure 7
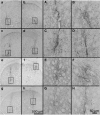
Striatal sections immunostained with DARPP-32 and counterstained with hematoxylin. The brown reaction product is DARPP-32, a specific striatal neuronal marker, which is reduced in response to striatal damage. Hematoxylin is a classical nuclear stain used, in this case, to detect infiltrating leukocytes. The fluctuations in staining intensities of these panels are not indicative of a difference between groups and only reflect variations in staining potencies; color comparisons should be made only within animals and not between groups. Bar in h = 500 µm and applies to a–h. Bar in H = 50 µm and applies to A–H that depict a fivefold increase in magnification of the corresponding boxed areas in a–h. (a,b) An animal that received rAAV2-GFP injection in right striatum (a), followed by second administration of rAAV2-GFP in left striatum 4 weeks later (b). Significant leukocyte infiltration is seen in the first hemispheres in the area of injection (a). Note the association of the infiltrate with blood vessels. Likewise, the DARPP-32 staining is greatly diminished in the injection site (as compared surrounding tissue) indicating local tissue damage. The second-injection site of the readministered animals was less affected 4 weeks following the second injection (b). DARPP-32 is also unaffected. (c,d) An animal that received rAAV2-GFP injection in right striatum (c), followed by second administration of rAAV2-GFP in left striatum 4 weeks later (d). This animal was killed 8 weeks after the second injection. Infiltrating cells persist at the first-injection site (c), and are now more pronounced in the area of the second injection (d). DARPP-32 staining was minimally affected in the area of infiltration. (e,f) An animal that received rAAV2-GFP injection in right striatum (e), followed by second administration of sterile saline in left striatum 4 weeks later (f). Again leukocyte infiltration is more pronounced in the first-injection site (e), as compared to the saline injection in the second site (f); however, compared to the treatment groups it is noticeably reduced. (g,h) An animal that received a sterile saline injection in right striatum (g), followed by second administration of sterile saline in left striatum 4 weeks later (h). In both the first-injection site (g), and the second-injection site (h), the needle tract is barely visible, and no cellular infiltration is notable and no reduction of DARPP-32 was visible. No sections of the single-injection animals are depicted here, but all of the animals had staining similar to the saline injections pictured in g and h. GFP, green fluorescent protein; rAAV2/2, recombinant adeno-associated virus 2/2.
<b>Figure 8</b>
Figure 8
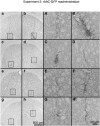
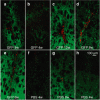
Green fluorescent protein (GFP) native fluorescence in transduced neurons in the striatum in sections stained for CD8α. Native GFP fluorescence is recognized by green fluorescence completely filling the transduced cells. Activated cytotoxic T cells expressing CD8 (α subunit), a coreceptor for major histocompatibility complex class 1 complexes on the surface of virally infected cells, are labeled in red. Note that the panels on the left side of the figure are from the right side of the brain to depict the order of administration from left to right. Bar in h = 100 µm and applies to a–h. (a,b) An animal that received rAAV2-GFP injection in right striatum (a), followed by second administration of rAAV2-GFP in left striatum 4 weeks later (b). GFP expression is greater in the first-injection side (a) than the second (b). Moderate CD8+ infiltration persists in both injection sites (a and b), but T-cell infiltration does not extend into the surrounding parenchyma. (c,d) An animal that received rAAV2-GFP injection in right striatum (c), followed by second administration of rAAV2-GFP in left striatum 4 weeks later (d). This animal was killed 8 weeks after the second injection. The first-injection site (c) maintains high levels of GFP production, while the second-injection site (d) is yet to achieve those levels seen at the 8-week time point (see a and e). High levels of CD8+ infiltration is evident in both injection sites (c and d), and is usually closely associated with a blood vessels (see d). (e,f) An animal that received rAAV2-GFP injection in right striatum (e), followed by second administration of sterile saline in left striatum 4 weeks later (f). GFP expression levels in the first site (e) are high and comparable to those seen in the first injection side of readministered animals (a and c) but much higher than the second injection side of readministered animals even at identical times of expression (d). CD8+ T-cell infiltration is limited to the needle tract, and is minimal. (g,h) An animal that received a sterile saline injection in right striatum (g), followed by second administration of sterile saline in left striatum 4 weeks later (h). In both the first-injection site (g), and the second-injection site (h), the needle tract is barely visible and minimal CD8+ T cells are detectable. No sections of the single-injection animals are depicted here, but GFP expression was robust and similar to control animals. Likewise all of those animals had immunostaining similar to the saline injections pictured in g and h. rAAV2/2, recombinant adeno-associated virus 2/2.
<b>Figure 9</b>
Figure 9
Experiments 3–6. Numbers of GFP+ striatal neurons were estimated using unbiased stereological sampling. Because recombinant adeno-associated virus 2/5 (rAAV2/5) is far more efficient in striatum than rAAV2/2, the data are presented as percent control in (a–c). (a) Experiment 3: striatal rAAV readministration of mismatched capsid serotypes. The three different injection patterns (as shown in Figure 1c) are separated by vertical dashed lines. The bars are organized in the order of injection and the identity of the vector capsid is given in the legend. Cytotoxic T lymphocyte (CTL) refers to single-injection controls that occurred at the same time as the first injection of the readministration groups. There is no statistical significance among any of the experimental groups. (b) Experiment 4: rAAV2/5 readministration. Furthermore, rAAV2/5-GFP was readministered in the opposite striatum of the same animals after 2 weeks. The first two bars represent the data from the first- and second-injection sites in the same animals. The third bar (CTL) refers to control animals that received one striatal rAAV2/5-GFP injection during the first surgical session. There are no statistically significant differences between the groups. (c) Experiment 5: delayed striatal rAAV2/2 readministration. Next, rAAV2/2-GFP was readministered in the opposite striatum of the same animals after 11 weeks. The first two bars represent the data from the first- and second-injection sites in the same animals. The third bar (CTL) refers to control animals that received one striatal rAAV2/2-GFP injection during the first surgical session. There is no statistical difference between the groups. (d) Experiment 6: rAAV2/2 readministration: cell-mediated immunity or transgene expression loss? Vector genomes as the dependent variable were assessed using real-time quantitative PCR. Animals received intrastriatal rAAV2/2-GFP (white bar, first injection + readministration) followed 2 weeks later by rAAV2/2-GFP (white bar, second injection) injections in the opposite striatum. Another group of animals received intrastriatal rAAV2/2-GFP without any further injection (gray bar, first injection). CTL refers to the uninjected side of the single-injected controls. There is no statistical difference between any of vector-injected groups. The asterisk denotes a statistically significant difference between the second injection (white bar) and the CTL blank controls (P = 0.01). GFP, green fluorescent protein.

Similar articles

Cited by

References

    1. Lowenstein PR, Mandel RJ, Xiong WD, Kroeger K., and , Castro MG. Immune responses to adenovirus and adeno-associated vectors used for gene therapy of brain diseases: the role of immunological synapses in understanding the cell biology of neuroimmune interactions. Curr Gene Ther. 2007;7:347–360. - PMC - PubMed
    1. Peden CS, Burger C, Muzyczka N., and , Mandel RJ. Circulating anti-wt-AAV2 Antibodies inhibit rAAV2-, but not rAAV5-mediated gene transfer in the brain. J Virol. 2004;78:6344–6359. - PMC - PubMed
    1. Mandel RJ, Manfredsson FP, Foust KD, Rising A, Reimsnider S, Nash K, et al. Recombinant adeno-associated viral vectors as therapeutic agents to treat neurological disorders. Mol Ther. 2006;13:463–483. - PubMed
    1. Daadi MM, Pivirotto P, Bringas J, Cunningham J, Forsayeth J, Eberling J, et al. Distribution of AAV2-hAADC-transduced cells after 3 years in Parkinsonian monkeys. Neuroreport. 2006;17:201–204. - PubMed
    1. Bankiewicz KS, Forsayeth J, Eberling JL, Sanchez-Pernaute R, Pivirotto P, Bringas J, et al. Long-term clinical improvement in MPTP-lesioned primates after gene therapy with AAV-hAADC. Mol Ther. 2006;14:564–570. - PubMed

Publication types

Substances

LinkOut - more resources