

FDG-PET changes in brain glucose metabolism from normal cognition to pathologically verified Alzheimer's disease
- PMID: 19142633
- PMCID: PMC2774795
- DOI: 10.1007/s00259-008-1039-z
FDG-PET changes in brain glucose metabolism from normal cognition to pathologically verified Alzheimer's disease
Abstract
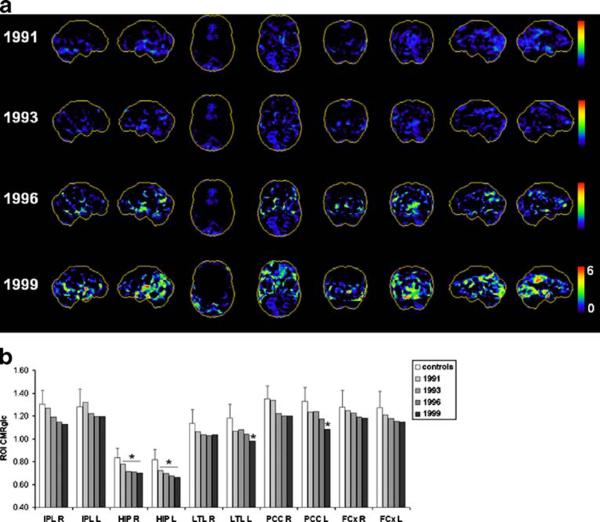
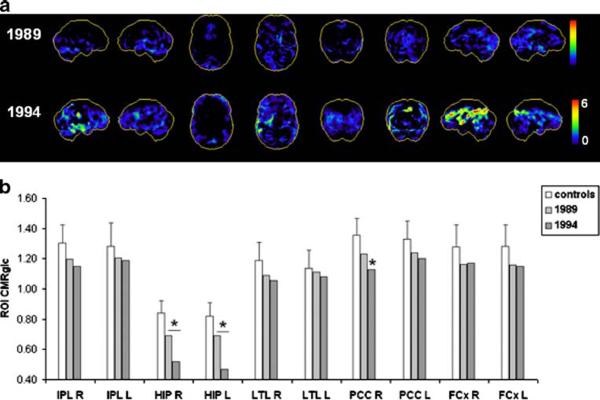
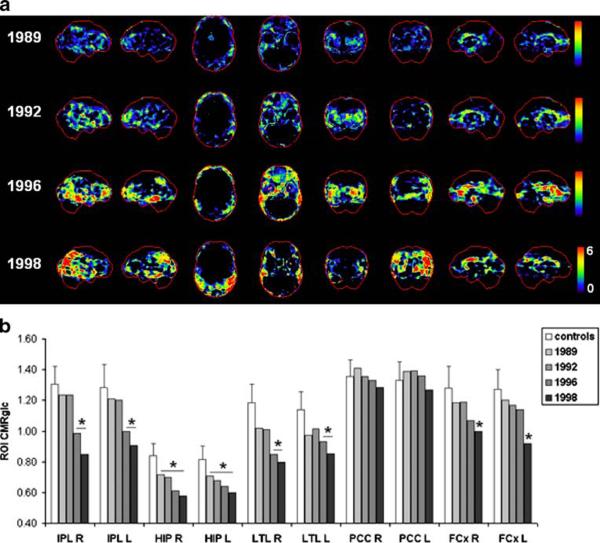
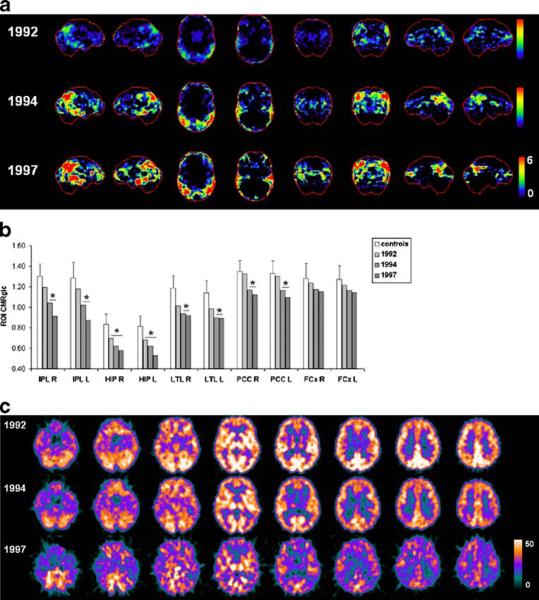
Purpose: We report the first clinicopathological series of longitudinal FDG-PET scans in post-mortem (PM) verified cognitively normal elderly (NL) followed to the onset of Alzheimer's-type dementia (DAT), and in patients with mild DAT with progressive cognitive deterioration.
Methods: Four NL subjects and three patients with mild DAT received longitudinal clinical, neuropsychological and dynamic FDG-PET examinations with arterial input functions. NL subjects were followed for 13 +/- 5 years, received FDG-PET examinations over 7 +/- 2 years, and autopsy 6 +/- 3 years after the last FDG-PET. Two NL declined to mild cognitive impairment (MCI), and two developed probable DAT before death. DAT patients were followed for 9 +/- 3 years, received FDG-PET examinations over 3 +/- 2 years, and autopsy 7 +/- 1 years after the last FDG-PET. Two DAT patients progressed to moderate-to-severe dementia and one developed vascular dementia.
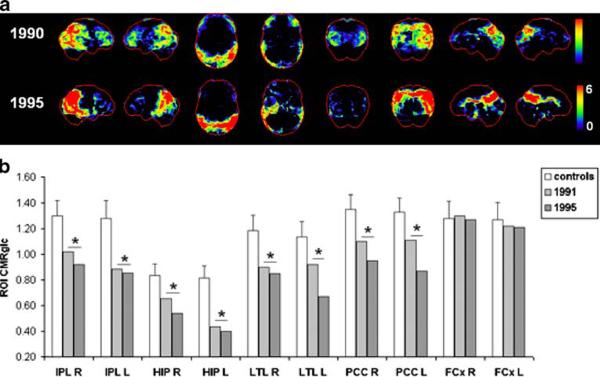
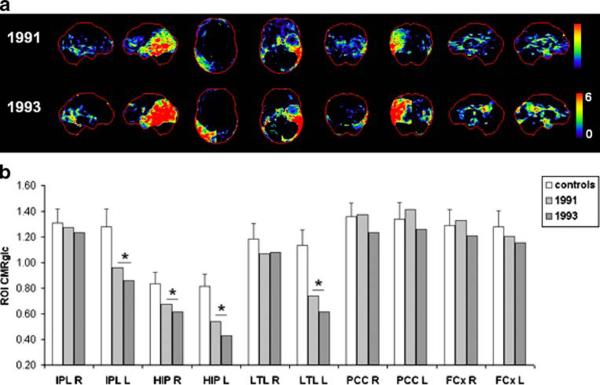
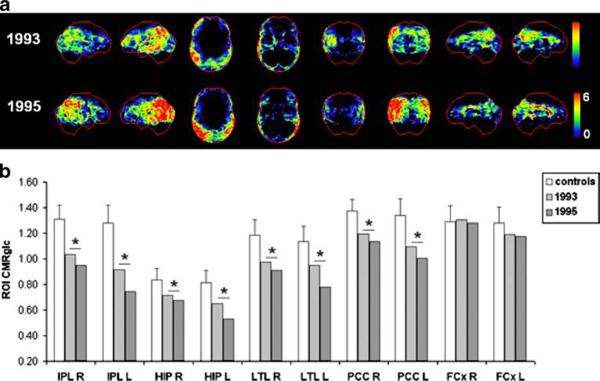
Results: The two NL subjects who declined to DAT received a PM diagnosis of definite AD. Their FDG-PET scans indicated a progression of deficits in the cerebral metabolic rate for glucose (CMRglc) from the hippocampus to the parietotemporal and posterior cingulate cortices. One DAT patient showed AD with diffuse Lewy body disease (LBD) at PM, and her last in vivo PET was indicative of possible LBD for the presence of occipital as well as parietotemporal hypometabolism.
Conclusion: Progressive CMRglc reductions on FDG-PET occur years in advance of clinical DAT symptoms in patients with pathologically verified disease. The FDG-PET profiles in life were consistent with the PM diagnosis.
Figures
References
-
- Mirra SS, Heyman A, McKeel D, et al. Part II. Standardization of the neuropathologic assessment of Alzheimer's disease. Neurol. 1991;41:479–86. - PubMed
-
- Price JL, Morris JC. Tangles and plaques in nondemented aging and “preclinical” Alzheimer's disease. Ann Neurol. 1999;45:358–68. - PubMed
-
- McKhann G, Drachman D, Folstein M, Katzman R, Price D, Stadlan EM. Clinical diagnosis of Alzheimer's disease: report of the NINCDS-ADRDA Work Group under the auspices of Department of Health and Human Services Task Force on Alzheimer's Disease. Neurology. 1984;34:939–44. - PubMed
-
- Mosconi L. Brain glucose metabolism in the early and specific diagnosis of Alzheimer's disease. Eur J Nucl Med. 2005;32:486–510. - PubMed
-
- Chetelat G, Desgranges B, De La Sayette V, Viader F, Eustache F, Baron JC. Mild cognitive impairment: can FDG-PET predict who is to rapidly convert to Alzheimer's disease. Neurology. 2003;60:1374–7. - PubMed
Publication types
MeSH terms
Substances
Grants and funding
LinkOut - more resources
Full Text Sources
Other Literature Sources
Medical
