Review
. 2009;48(5):872-97.
doi: 10.1002/anie.200802585.

Nanomedicine--challenge and perspectives

Affiliations
Review

Nanomedicine--challenge and perspectives

Kristina Riehemann et al. Angew Chem Int Ed Engl. 2009.

Abstract

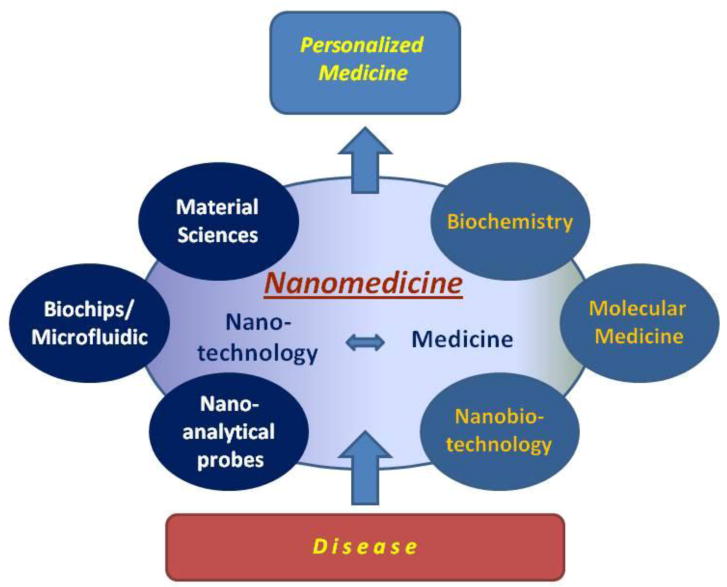
The application of nanotechnology concepts to medicine joins two large cross-disciplinary fields with an unprecedented societal and economical potential arising from the natural combination of specific achievements in the respective fields. The common basis evolves from the molecular-scale properties relevant to the two fields. Local probes and molecular imaging techniques allow surface and interface properties to be characterized on a nanometer scale at predefined locations, while chemical approaches offer the opportunity to elaborate and address surfaces, for example, for targeted drug delivery, enhanced biocompatibility, and neuroprosthetic purposes. However, concerns arise in this cross-disciplinary area about toxicological aspects and ethical implications. This Review gives an overview of selected recent developments and applications of nanomedicine.


Figures

Figure 1
Figure 1
Nanotechnology and medicine. Prostate cancer cells have taken up fluorescently labeled nanoparticles (shown in red). As targeting molecules on the nanoparticles RNA aptamers binding to the prostate-specific membrane antigen (PSMA; a well-known transmembrane protein, which is overexpressed on prostate cancer epithelial cells) was used. The cell nuclei and cytoskeletons are stained blue and green, respectively. Similarly designed targeted nanoparticles are capable of getting inside cancer cells and releasing lethal doses of chemotherapeutic drugs to eradicate tumors. Reprinted with permission from American Association for the Advancement of Science (AAAS).[13]
Figure 2
Figure 2
Example of a lab-on-chip technology for biological applications. A multiplicity of branched microfluidic channels (between white double lines) bear a variety of different electrode layouts (black fine lines) for applications like cell imprinting, cell fusion or cell separation. Fluidic connection is realized on the backside, electronic connection via the 2×30-pole interfaces (green boards). For size comparison a one Euro-coin at the lower left corner. Kindly provided by M. Jäger, Fraunhofer IBMT, Potsdam, Germany.
Figure 3
Figure 3
Photolitographic techniques for manufacturing of a) DNA and b) proteomics micro and nano-arrays: a) Microarrays exemplify the patterning of biological molecules on surfaces, with exquisite control over their spatial placement, for instance to obtain DNA sequencing by hybridization on a chip. In the figure, blue squares represent photolabile groups, which are selectively illuminated through a mask (a process known as photolithography) and removed to expose reactive groups. Sequential application of the procedure yields single-stranded hybridization probes of preselected vertical sequences at predetermined locations on the microarray. The technique of photolithography was adapted from the microelectronic industry. The ability to control the lateral dimensions of each square in the checkerboard of a microarray was originally of the order of 100 microns (or 100,000 nanometres). Now, the linear spatial resolution of lithography is 1,000 times better, indicating that up to a one-million-fold increase in information density could be packed in ‘nanoarrays’; b) photolithography can be used to pattern different chemistries, biological moieties and physical textures on substrates, for the purpose of prefractionation of protein mixtures before investigation by time-of-flight spectrometry. Different proteomic patterns are produced by different substrate treatments, on contact with the same biological sample. The panels to the right illustrate different nanochanneled surfaces, which selectively retain proteins and proteolytic fragments. This has the effect of ‘focusing’ the resulting protein profiles in different molecular-weight ranges. Reprinted by permission from Macmillan Publishers Ltd.[58]
Figure 4
Figure 4
Presentation of working principle of a) nano-cantilevers and b) nano wires: a) Nanocantilever array. The biomarker proteins are affinity-bound to the cantilevers and cause them to deflect. The deflections can be directly observed with lasers. Alternatively, the shift in resonant frequencies caused by the binding can be electronically detected. As for nanowire sensors, the breakthrough potential in nanocantilever technology is the ability to sense a large number of different proteins at the same time, in real time; b) Nanowires deployed within a microfluidic system. Different colors indicate that different molecules (colored circles) adsorb or affinity-bind to different nanowire sensors. The binding causes a change in conductance of the wires, which can be electronically and quantitatively detected in real time. The working principle is that of a (biologically gated) transistor and is illustrated in the insert. The charges of the binding protein disrupt electrical conduction in the underlying nanowire. The ‘nano’ size of the wire is required to attain high signal-to-noise ratios. Reprinted by permission from Macmillan Publishers Ltd.[58]
Figure 5
Figure 5
a): Size- and material-dependent emission spectra of several surfactant-coated semiconductor nanocrystals in a variety of sizes: A: The blue series represents different sizes of CdSe nanocrystals with diameters of 2.1, 2.4, 3.1, 3.6, and 4.6 nm (from right to left). The green series is of InP nanocrystals with diameters of 3.0, 3.5, and 4.6 nm. The red series is of InAs nanocrystals with diameters of 2.8, 3.6, 4.6, and 6.0 nm; B: A true-color image of a series of silica-coated core (CdSe)-shell (ZnS or CdS) nanocrystal probes in aqueous buffer, all illuminated simultaneously with a handheld ultraviolet lamp; b) Cross section of a dual-labeled sample. Reprinted by permission from American Association for the Advancement of Science (AAAS).[74]
Figure 6
Figure 6
Optical Microscopy (OM), ion induced electron (IIE) and boron distribution (10B) detected by laser SNMS are shown in the upper row. In the bottom row intents signals from molecules like C3, CN and C3H8N are observed, representing lipids, proteins and nucleic acids. Samples were taken from a kidney of a NMRI nude mouse and treated with a combination of sodium mercaptoundecahydro-closododecaborate (BSH) and p-boronophenylelanine (BPA). Reprinted with permission from Elsevier.[81]
Figure 7
Figure 7
Surface analysis of native stratum corneum (SC) derived from human skin applying atomic force microscopy. Comparison of atrophic skin (a and c) and healthy skin (b and d) reveals a reduced SC integrity of atrophic skin indicated by enlarged intercellular gaps between the individual corneocytes (a, b white arrows). While the surface morphology of healthy SC is characterized by filamentous structures forming a dense network across the SC (b, d), the surface of corneocytes of atrophic skin is characterized by regular shaped hump-like structure (c). Black bars (a, b) correspond to 5 μm, black squares mark the surface region presented as a three-dimensional image (c,d). (unpublished, S. W. Schneider, Department of Dermatology, Münster, Germany)
Figure 8
Figure 8
Trajectories of single AAV-Cy5 particles indicating infectious entry pathways of AAVs into a living cervical cancer cell line (HeLa). The traces showing single diffusing virus particles were recorded at different times. They describe various stages of AAV infection, e.g. diffusion in solution (1 and 2), touching at the cell membrane (2), penetration of the cell membrane (3), diffusion in the cytoplasm (3 and 4), penetration of the nuclear envelope (4), and diffusion in the nucleoplasm. Reprinted with permission from AAAS.[111]
Figure 9
Figure 9
Comparison of fluorescence imaging techniques: a) Confocal, b) STED, and c) Richardson Lucy deconvolved STED images of neurofilaments (green: light subunits, red: α-internexin). d) In contrast to the confocal image, STED reveals three well-separated α-internexin strands of the axon. e) Structures of the light subunits exhibit a Full Width at Half Maximum (FWHM) < 40 nm, a measure for the reolution of the imaging method. Note the different organization of the light subunits and α-internexin. Reprinted with permission.[121]
Figure 10
Figure 10
Different types of nanovectors: a) First-generation nanovectors (e.g. currently clinical liposomes) comprise a container and an active principle. They localize in the tumor by Enhanced Permeation and Retention (EPR), or the enhanced permeability of the tumor neovasculature; b) Second-generation nanovectors further possess the ability for the targeting of their therapeutic action via antibodies and other biomolecules, remote activation, or responsiveness to environment; c) Third-generation nanovectors such as multistage agents are capable of more complex functions, such a time-controlled deployment of multiple waves of active NPs, deployed across different biological barriers and with different sub-cellular targets. Reprinted by permission from Macmillan Publishers Ltd.[58]
Figure 11
Figure 11
Mechanism of action of multistage (3rd generation) nanovectors. Top-left: rationally designed stage one particles marginate to the vessel wall and adhere to the endothelium. Top-right: stage one particles release a penetration enhancer to break down tight junctions and the basement membrane and release stage two particles – in this instance, liposomes. Bottom: the stage two liposomes interact with the target cell membrane, and then deliver the intended payload – in this example, siRNA. Reprinted with permission.[151]
Figure 12
Figure 12
Functionalized nanoparticles for nerve regeneration: a) Molecular graphics illustration of an IKVAV-containing peptide amphiphile molecule; b) Self assembled Network of IKVAV amphiphiles; c) Supported by a nanofiber network progenitor cells differentiated to functioning neurons instead of scarforming astrocyte. Reprinted with permission from AAAS.[182]
Figure 13
Figure 13
Examples for polymer–anticancer drug conjugates: a) Paclitaxel (PTX), an anticancer agent, is linked to the carrier polyglutamate (PGA) via an ester bond. It was shown that the main drug release occurred subsequent to polymer degradation by the lysosomal enzyme cathepsin B; b) Conjugate of camptothecin (CPT) and a linear cyclodextrin-based polymer (CDP). The components of CDP are β-cyclodextrin and PEG. Pharmacokinetic and preclinical studies have demonstrated that this conjugate exhibits a longer plasma half-life and better distribution to the tumor tissue than does CPT alone. Reprinted with permission.[234]
Figure 14
Figure 14
Comparison of a healthy and a tumor cell incubated with nanoparticles. In a phase-contrast light microscopic picture a prostate carcinoma cell and a fibroblast cell were compared. While the tumor cell (left) shows remarkable pigmentation due to large nanoparticle uptake, the adjacent fibroblast cell depicts lower pigmentation, i.e. no or lower particle uptake. Reprinted with permission from Elsevier.[246]
Figure 15
Figure 15
Phase contrast optical micrographs of 3T3 fibroblasts on Polyethylene Glycol Diacrylate (PEGDA) 700 hydrogels. a) Cells on a non-RGD-functionalized gold nanoparticle pattern. (b–d) Cells on cyclo(-RGDfK-)-functionalized gold particles; cyclo(-RGDfK-) patches are separated by varying distances b) 40 nm, c) 80 nm, and d) 100 nm, after 24 h. in culture. e) Dense cell layer on a PEG support after 14 days in culture. The bottom part of the sample was patterned with cyclo(-RGDfK-) peptide-functionalized gold nanoparticles spaced 40 nm apart. Reprinted with permission.[266]
Figure 16
Figure 16
SEM microphotograph of a granulomatous liver section: a) two small particles and a cluster of nanodebris in between;. b) and c) EDS spectra reveal that the debris have different compositions, and probably have different origins. Reprinted with permission from Elsevier.[295]
Scheme 1
Scheme 1
Technologies involved in the field of nanomedicine

References

    1. Feynman RP. In: Nanotechnology: Research and Perspectives. Lewis J, editor. MIT Press; Boston: 1992. p. 347.
    1. Gleiter H. Prog Mat Sci. 1989;33:223.
    1. Binnig G, Rohrer H, Gerber C, Weibel E. Phys Rev Lett. 1982;49:57.
    1. National Nanotechnology Initiative. Leading to the Next Industrial Revolution A Report by the Interagency Working Group on Nanoscience, Engineering and Technology. Washington, DC: Committee on Technology, National Science and Technology Council; 2000.
    1. Oberdorster G, Oberdorster E, Oberdorster J. Environ Health Perspect. 2007;115:A290. - PMC - PubMed

Publication types

MeSH terms

Substances

LinkOut - more resources