. 2009 Apr 1;69(5):505-19.
doi: 10.1002/pros.20898.

Quantification of phase I/II metabolizing enzyme gene expression and polycyclic aromatic hydrocarbon-DNA adduct levels in human prostate

Affiliations

Quantification of phase I/II metabolizing enzyme gene expression and polycyclic aromatic hydrocarbon-DNA adduct levels in human prostate

Kaarthik John et al. Prostate. .

Abstract

Background: Studies of migrant populations suggest that dietary and/or environmental factors play a crucial role in the etiology of prostatic adenocarcinoma (CaP). The human prostate consists of the peripheral zone (PZ), transition zone (TZ), and central zone (CZ); CaP occurs most often in the PZ.

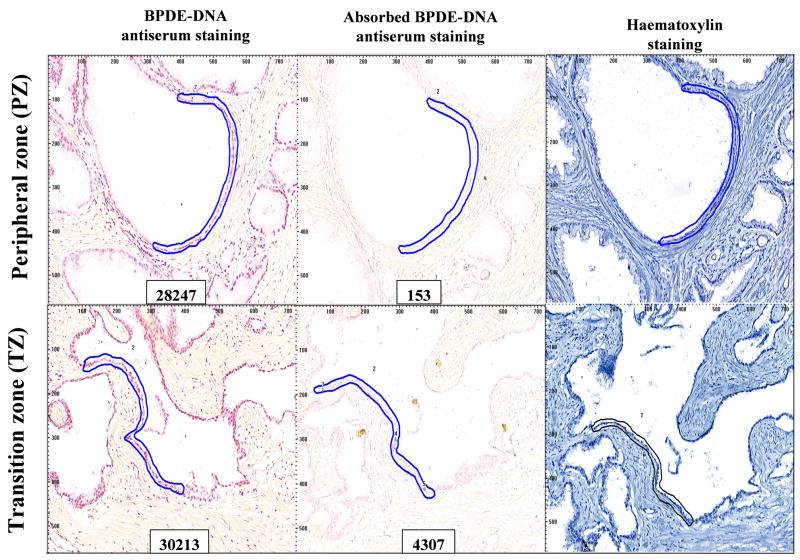
Methods: To investigate the notion that an underlying differential expression of phase I/II genes, and/or the presence of polycyclic aromatic hydrocarbon (PAH)-DNA adducts might explain the elevated PZ susceptibility, we examined prostate tissues (matched tissue sets consisting of PZ and TZ) from men undergoing radical retropubic prostatectomy for CaP (n = 26) or cystoprostatectomy (n = 1). Quantitative gene expression analysis was employed for cytochrome P450 (CYP) isoforms CYP1A1, CYP1B1, and CYP1A2, as well as N-acetyltransferase 1 and 2 (NAT1 and NAT2) and catechol-O-methyl transferase (COMT).

Results: CYP1B1, NAT1, and COMT were expressed in all tissue sets; levels of CYP1B1 and NAT1 were consistently higher in the PZ compared to TZ. Immunohistochemistry confirmed the presence of CYP1B1 (nuclear-associated and primarily in basal epithelial cells) and NAT1. Normal tissue from 23 of these aforementioned 27 matched tissue sets was analyzed for PAH-DNA adduct levels using antiserum elicited against DNA modified with r7,t8-dihydroxy-t-9,10-oxy-7,8,9,10-tetrahydro-benzo[a]pyrene (BPDE). PAH-DNA adduct levels were highest in glandular epithelial cells, but a comparison of PZ and TZ showed no significant differences.

Conclusion: Although expression of activating and/or detoxifying enzymes may be higher in the PZ, PAH-DNA adduct levels appear to be similar in both zones. Therefore, factors other than PAH-DNA adducts may be responsible for promotion of tumor formation in the human prostate.


Conflict of interest statement

Conflict of interest statement – None declared. None of the authors have financial interests or other interests that might be prejudicial to the interpretation or presentation of the work contained within this manuscript.

Figures

Fig. 1
Fig. 1
Immunohistochemical staining of the prostate tissues. Anti-CYP1B1 staining in (A) PZ of Patient no. 2 showing the presence of a distinct pattern of nuclear-associated staining in cancer-free glandular epithelial cells (blue arrows) and stroma (yellow arrows); (B) in adjacent CaP tissue (identified by the pathologist in the separate lobe) from Patient no. 2, sheaths of cells exhibiting both nuclear-associated staining and cytoplasmic staining (red arrows); (C) TZ of Patient no. 2 showing the presence of a distinct pattern of nuclear-associated staining in cancer-free glandular epithelial cells (blue arrows) and stroma (yellow arrows); and (D) CZ of Patient no. 25 who underwent a cystaprostatectomy, showing an apparent absence of positive staining in the typical large glandular elements (green arrows). Anti-NAT1 staining in (E) CZ (green arrows) compared to PZ (blue arrows) of Patient no. 25 who underwent a cystaprostatectomy; (F) PZ of Patient no. 25 showing the presence of a distinct pattern of nuclear-associated and cytosolic staining in cancer-free glandular epithelial cells (blue arrows); (G) TZ of Patient no. 25 showing the presence of a distinct pattern of nuclear-associated and cytosolic staining in cancer-free glandular epithelial cells (yellow arrows); and (H) TZ of Patient no. 25 showing the presence of a distinct pattern of nuclear-associated and cytosolic staining in cancer-free glandular epithelial cells (yellow arrows), at a higher magnification than before. Scale bar = 50 μm
Fig. 2
Fig. 2
Standard curve consisting of cultured human keratinocytes exposed to 0, 0.25 μM, 0.50 μM, 0.75 μM or 1.00 μM BPDE for 1 h. (A) Top row of IHC photos shows nuclear staining of cells that were formalin-fixed, embedded in paraffin arrays, and stained with specific BPDE-DNA antiserum, a secondary antibody and Fast Red (pink color). Inserts contain staining intensity values (OD/nucleus) for the pink color determined by ACIS. Bottom row of photos shows cells cultured and fixed the same as cells in the top row, but stained with specific BPDE-DNA antiserum absorbed with the immunogen BPDE-DNA, a secondary antibody and Fast Red. Inserts contain staining intensity values (OD/nucleus) for the pink color determined by ACIS. (B) Portions of the cultured keratinocytes shown in (A) were analyzed by BPDE-DNA CIA after DNA extraction, and the BPdG adducts/108 nucleotides are shown as a function of dose. Values are mean ± range for 2 assays each with triplicate wells. (C) Standard curve consisting of BPdG adducts visualized by IHC/ACIS (OD/nucleus, ordinate), plotted as a function of BPdG adducts/108 nucleotides determined by BPDE-DNA CIA (abscissa). Values represent mean ± range for 2 CIAs (each with triplicate wells), and mean ± range for 2 IHC arrays, with staining of 3 cores and 3 regions/core for each experimental group. Each major division on the scale represents 100 μm with each sub-division within representing 10 μm.
Fig. 3
Fig. 3
Immunostaining for PAH-DNA adducts in selected areas of PZ and TZ obtained from Patient no. 2. The left panels show staining of one region with BPDE-DNA antiserum. The middle panels show staining of the same region with BPDE-DNA-absorbed BPDE-DNA antiserum, and the right panels show staining of the same region with hematoxylin. These are identical regions obtained from serial cross-sections. Inserts contain values for OD/nucleus for the region outlined in blue. The numbers of nuclei were obtained by manually counting the blue cells within the demarcated area.
Fig. 4
Fig. 4
Staining intensity (OD/nucleus) determined by IHC/ACIS for matched sets of PZ (A) and TZ (B) tissues from all 23 individuals, stained with either specific BPDE-DNA antiserum (grey bars) or BPDE-DNA-absorbed BPDE-DNA antiserum (black bars).
Fig. 5
Fig. 5
PAH-DNA adducts/108 nucleotides, obtained from the IHC/ACIS OD/nucleus values (with absorbed serum subtracted) by calculation from the standard curve (Figure 2C). Shown here are adduct values for PZ (A) and TZ (B) for all 23 individuals. There were no statistically-significant differences between PAH-DNA adduct levels in the two groups when evaluated by Wilcoxon signed rank test (P = 0.66).

References

    1. Cancer Research UK. http://info.cancerresearchuk.org/cancerstats/types/prostate/
    1. Parkin DM, Bray F, Ferlay J, Pisani P. Global cancer statistics, 2002. CA Cancer J Clin. 2005;55:74–108. - PubMed
    1. Hsing AW, Tsao L, Devesa SS. International trends and patterns of prostate cancer incidence and mortality. Int J Cancer. 2000;85:60–67. - PubMed
    1. Sim HG, Cheng CW. Changing demography of prostate cancer in Asia. Eur J Cancer. 2005;41:834–845. - PubMed
    1. Collin SM, Martin RM, Metcalfe C, et al. Prostate-cancer mortality in the USA and UK in 1975–2004: an ecological study. Lancet Oncol. 2008;9:445–452. - PMC - PubMed

Publication types

MeSH terms