. 2009 Jan 13;7(1):e10.
doi: 10.1371/journal.pbio.1000010.

The influence of catalysis on mad2 activation dynamics

Affiliations

The influence of catalysis on mad2 activation dynamics

Marco Simonetta et al. PLoS Biol. .

Abstract

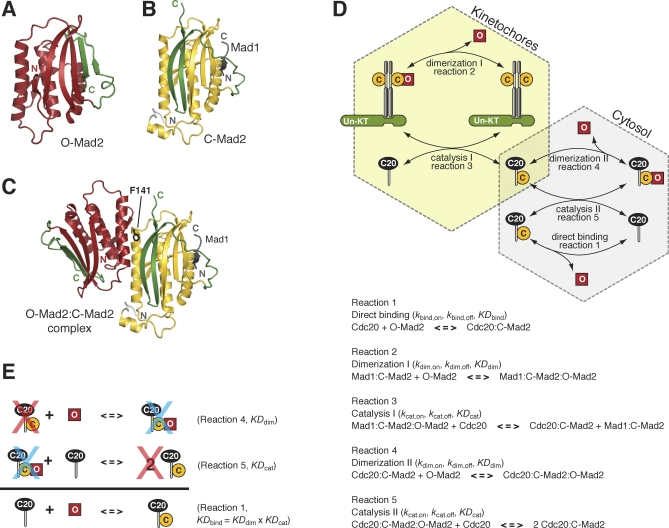
Mad2 is a key component of the spindle assembly checkpoint, a safety device ensuring faithful sister chromatid separation in mitosis. The target of Mad2 is Cdc20, an activator of the anaphase-promoting complex/cyclosome (APC/C). Mad2 binding to Cdc20 is a complex reaction that entails the conformational conversion of Mad2 from an open (O-Mad2) to a closed (C-Mad2) conformer. Previously, it has been hypothesized that the conversion of O-Mad2 is accelerated by its conformational dimerization with C-Mad2. This hypothesis, known as the Mad2-template hypothesis, is based on the unproven assumption that the natural conversion of O-Mad2 required to bind Cdc20 is slow. Here, we provide evidence for this fundamental assumption and demonstrate that conformational dimerization of Mad2 accelerates the rate of Mad2 binding to Cdc20. On the basis of our measurements, we developed a set of rate equations that deliver excellent predictions of experimental binding curves under a variety of different conditions. Our results strongly suggest that the interaction of Mad2 with Cdc20 is rate limiting for activation of the spindle checkpoint. Conformational dimerization of Mad2 is essential to accelerate Cdc20 binding, but it does not modify the equilibrium of the Mad2:Cdc20 interaction, i.e., it is purely catalytic. These results surpass previously formulated objections to the Mad2-template model and predict that the release of Mad2 from Cdc20 is an energy-driven process.


Conflict of interest statement

Competing interests. The authors have declared that no competing interests exist.

Figures

Figure 1
Figure 1. Chemical Reactions That Control the Activation of the SAC
(A) Ribbon model of O-Mad2 [39]. Ribbon models were obtained with PyMol, by DeLano Scientific (http://www.pymol.org). The invariant core of the structure (N) is shown in red. The C-terminal mobile element (C), known as the “safety belt” [22], is in green. (B) Ribbon model of C-Mad2. The core of the structure is coloured yellow, with the C-terminal tail and safety belt in green. A segment of Mad1 that stabilizes the C-Mad2 conformation is shown in grey [22]. (C) Ribbon diagram of the O-Mad2:C-Mad2 asymmetric dimer with same colour codes as (A) and (B) [14]. (D) The Mad2 template model [13]. O-Mad2 and C-Mad2 are represented with red squares and yellow circles, respectively. Mad1 is represented with grey cylinders. The Mad2 binding site in Mad1 and Cdc20 is shown as a thin grey cylinder. The light-yellow hexagon includes all the reactions taking place at unattached kinetochores (Un-KT), while the grey hexagon includes cytosolic reactions. Cdc20:C-Mad2 is the only chemical species that belongs to both sets. The reactions describe binding (1), dimerization (2 and 4), and catalysis (3 and 5). An underlying hypothesis of these reactions is the presence of a highly unstable form of active Mad2, I-Mad2, more prone to bind Cdc20 than O-Mad2. For the sake of simplicity, we do not include it explicitly in our reaction scheme. In Table S1, we report the differential equations formalizing the reaction network. (E) The reactions of dimerization and catalysis form a closed loop that produces the binding reaction. Since no energy is introduced into the system, microscopic reversibility applies, and the hypothetical reaction does not affect the equilibrium of the system.
Figure 2
Figure 2. Mad2wt Binds Cdc20 Faster Than Mad2F141A
(A) Chromatographic analysis of Mad2wt and Mad2F141A. In agreement with previous studies [10,14], both Mad2 species can be purified in an O-Mad2 conformation that is identified based on the salt concentration (dotted line) at which these species elute from an anion exchange column. Mad2 species in the C-Mad2 conformation (yellow circle) elute at higher salt concentrations relative to the O-Mad2 species (red square) [10,14]. (B) Mad2wt and Mad2F141A were separated on a Superdex-75 10/30 column. Both proteins elute as expected for monomeric forms. Dotted line represents the elution volumes of gel filtration standards. (C) GST-Cdc20111−138 (at 1 μM total concentration) was immobilized on GSH-agarose beads, and incubated for 24 h at room temperature with 1 μM Mad2wt or Mad2F141A. The binding reactions were then analysed by SDS-PAGE. Band intensities were quantified by densitometric analysis, and the ratio between GST-Cdc20 and Mad2 bands were used to calculate the fraction of Mad2/Cdc20 complexes. Standard deviations (error bars) were calculated from experiments repeated three or more times. (D) The experiment described in (C) was carried out as a time course using 1 μM GST-Cdc20111−138 and 2 μM Mad2wt or Mad2F141A. SDS-PAGE gels were digitized, and the intensity of the bound fractions plotted as a function of time. As in (B), error bars indicate the standard deviation calculated from three or more experiments.
Figure 3
Figure 3. Kinetic Analysis for Rate Constants Determination of Mad2F141A
(A) The different Mad2 species used in the analysis retained their O-Mad2 conformation (left) and monomeric state (right) after covalent labelling with Alexa Fluor 488. After SDS-PAGE separation, the Alexa-labelled species were visualized under a UV transilluminator. (B) A flow chamber was built in which a biotinylated Cdc20 peptide (∼1 μM Cdc20, measured as the moles of peptide bound onto the surface divided by the volume of the chamber in litres; Figure S4) is immobilized onto the bottom surface through a biotin-streptavidin interaction. After addition of fluorescent Mad2, bound Mad2 can be visualized. The montage shows the specificity of the binding reaction. A black star characterizes Mad1F141 as opposed to Mad2wt; red squares indicate O-Mad2; yellow circles indicate C-Mad2; and a green dot represents a fluorescent label. (C) Real-time binding experiment using Alexa-Mad2F141A. The experiment was carried out at several Mad2 concentrations as indicated in the plot. (D) Fitting of the binding experiment with reaction 1 of Table S1. Parameters that gave the best fitting are reported in Table I. The fitting was carried out contemporarily on all available curves and at different concentrations as described in Text S1. As for the goodness of the fit, see Text S1 and Figure S5.
Figure 4
Figure 4. Kinetic Analysis for Rate Constants Determination of Mad2wt
(A) Different concentrations of Mad2wt were introduced in a flow chamber containing approximately 1 μM Cdc20. (B) Fitting of the binding curves of Mad2wt with reactions 1, 4, and 5 (Table S1 and Table S2) and parameters in Table I. The fitting was carried out contemporarily on all available curves and at different concentrations as described in Text S1. As for the goodness of the fit, see Text S1 and Figure S5. In the first panel (1 μM), a fit with only reactions 1 and 4 is also shown to demonstrate the importance of adding catalysis (reactions 5) in the fitting process. Notice how for low concentrations of Mad2, the kinetics follows a sigmoidal increase reflecting the slow initial binding of Mad2wt to Cdc20.
Figure 5
Figure 5. Testing the Predictions of the Model
(A) The time course of accumulation of Mad2wt (at 2 μM concentration) on a surface exposing Cdc20 is shown through the fit to the experimentally determined binding curves (black line). The red line is a prediction of the effects on Mad2wt binding to the surface due to the presence of 0.25 μM Mad1:C-Mad2 interspersed with Cdc20. The prediction is that the reaction is accelerated because Mad2wt can now rapidly bind to C-Mad2 in the Mad1:C-Mad2 complex, as a consequence of which, its transfer to Cdc20 is accelerated. Parameters are listed in Table 1, equations in Tables S1 and S2. (B) Experimental determination (curves defined by yellow and blue dots) of the binding of 2 μM O-Mad2wt to the Cdc20-exposing surface in the presence of Mad1:C-Mad2. There is excellent agreement between the prediction (red curve, the same shown in [A]) and the experiments. Red squares indicate O-Mad2; yellow circles indicate C-Mad2; green dots indicate fluorescent labels. (C) Similarly to (A), the model predicts that the rate of Cdc20:C-Mad2 binding can be accelerated by the presence of preformed Cdc20:C-Mad2. Black solid line: the fit to the experimentally determined binding curves; in red: the predicted timing of Cdc20:C-Mad2 formation in presence of pretreatment of the surface with 0.2 μM Mad2wt. Parameters are listed in Table 1, equations in Tables S1 and S2. (D) Experimental results confirm the prediction of the model. The chamber was pretreated with 0.2 μM nonfluorescent Mad2wt until the reaction reached equilibrium. The remaining Mad2wt was washed from the chamber, and 2 μM fluorescent Mad2wt were added in solution. There is excellent agreement between the prediction (red curve, the same shown in [A]) and the experiments (blue dots). (E) The role of p31comet in the SAC is based on its ability to interact with C-Mad2 bound to either Mad1 or Cdc20 in a manner that is competitive with the binding of O-Mad2. p31comet is a negative regulator of the SAC [21,29,37,47]. (F) The black line shows the same time course of accumulation of Mad2wt (at 2 μM concentration) on a surface exposing Cdc20 that was shown in (A). The red line indicates a prediction of the effects on Mad2wt binding to the surface exposing Cdc20 of adding 10 μM p31comet. (Parameters are listed in Table 1, equations in Tables S1 and S2.) The prediction is that the reaction is strongly delayed because p31comet binds tightly to the Cdc20:C-Mad2 complex on the surface and prevents the recruitment of additional Mad2wt through dimerization and catalysis. (G) The prediction in (D) is fully satisfied by experimental determination of the binding of 2 μM Mad2wt to Cdc20 in the presence of 10 μM p31comet (blue dots). The time course of Mad2wt is strongly delayed by p31comet, and it now resembles the rate observed in the presence of 2 μM Mad2F141A, whose fitting is shown with a black line. P31, p31comet.
Figure 6
Figure 6. Models of Checkpoint Activation in Living Cells
(A) In the presence of physiological concentrations of Mad2, Mad1:C-Mad2, and Cdc20, the full model of Figure 1D (reactions 1 to 5) starts with all Cdc20 and O-Mad2 in the free form. The timing and levels of Cdc20 sequestration in a Cdc20:C-Mad2 complex are plotted. The Mad2F141A mutant (blue line) sequesters Cdc20 extremely slowly. Mad2wt is faster, but still too slow to account for the rapid SAC activation observed in living cells. Only if we arbitrarily assume catalysis at the unattached kinetochores (i.e., at Mad1:C-Mad2) to be 300 times faster in vivo than in vitro (orange line), the activation timing is satisfactory. Only in the presence of preformed Mad1:C-Mad2 can the unattached kinetochores effectively reduce the SAC activation timing. If the Mad1:C-Mad2 complex had to form from Mad1 and O-Mad2, the initial SAC response would be slow even when the catalytic activity of kinetochores (green line) is increased 300 times. Thus, Mad1:C-Mad2 must exist at the beginning of SAC activation for the Cdc20:C-Mad2 complex to accumulate rapidly. Parameters are listed in Table 1, equations in Tables S1 and S2. (B) Graphical representations—adapted from the work of Barkai and collaborators [17]—of different SAC models. The small circle with radius ρ represents a kinetochore in a cell (circle with radius R) in which a given reaction (labelled “at the centre”) takes place. The self-propagating inhibition model and the emitted inhibition model were proposed by Barkai and collaborators [17], whereas the Mad2 template model [13] is described with a formalism similar to that adopted in [17]. Note that here, the only irreversible reaction is the reactivation of the inhibited form of the cell cycle progression protein c. The self-propagation model is distinct from the Mad2 template model. (See Discussion for more detailed descriptions of c, c*, e, and e*.) (C) A speculative representation of the energy profile of the formation of the MCC complex. ΔG1 to ΔG4 describe Gibbs' free energies for the four reactions described in the diagram. The first step of the preferred route to MCC formation is the formation of the Cdc20:C-Mad2 complex. The reaction is spontaneous, but the activation energy is extremely high. Conformational dimerization catalysed by Mad1:C-Mad2, and unknown additional factors can lower the activation energy, but the equilibrium of the reaction is unchanged. The formation of the MCC complex eventually takes place through the binding of Cdc20:C-Mad2 to a preformed BubR1:Bub3 complex. Red squares indicate O-Mad2; yellow circles indicate C-Mad2.

References

    1. Nasmyth K. Separating sister chromatids. Trends Biochem Sci. 1999;24:98–104. - PubMed
    1. Musacchio A, Salmon ED. The spindle-assembly checkpoint in space and time. Nat Rev Mol Cell Biol. 2007;8:379–393. - PubMed
    1. Peters JM. The anaphase promoting complex/cyclosome: a machine designed to destroy. Nat Rev Mol Cell Biol. 2006;7:644–656. - PubMed
    1. King EM, van der Sar SJ, Hardwick KG. Mad3 KEN boxes mediate both Cdc20 and Mad3 turnover, and are critical for the spindle checkpoint. PLoS ONE. 2007;2:e342. doi: 10.1371/journal.pone.0000342. - DOI - PMC - PubMed
    1. Burton JL, Solomon MJ. Mad3p, a pseudosubstrate inhibitor of APCCdc20 in the spindle assembly checkpoint. Genes Dev. 2007;21:655–667. - PMC - PubMed

Publication types