. 2009 Jan 13:10:2.
doi: 10.1186/1471-2202-10-2.

Lentivirus-mediated transgene delivery to the hippocampus reveals sub-field specific differences in expression

Affiliations

Lentivirus-mediated transgene delivery to the hippocampus reveals sub-field specific differences in expression

Lenneke W A van Hooijdonk et al. BMC Neurosci. .

Abstract

Background: In the adult hippocampus, the granule cell layer of the dentate gyrus is a heterogeneous structure formed by neurons of different ages, morphologies and electrophysiological properties. Retroviral vectors have been extensively used to transduce cells of the granule cell layer and study their inherent properties in an intact brain environment. In addition, lentivirus-based vectors have been used to deliver transgenes to replicative and non-replicative cells as well, such as post mitotic neurons of the CNS. However, only few studies have been dedicated to address the applicability of these widespread used vectors to hippocampal cells in vivo. Therefore, the aim of this study was to extensively characterize the cell types that are effectively transduced in vivo by VSVg-pseudotyped lentivirus-based vectors in the hippocampus dentate gyrus.

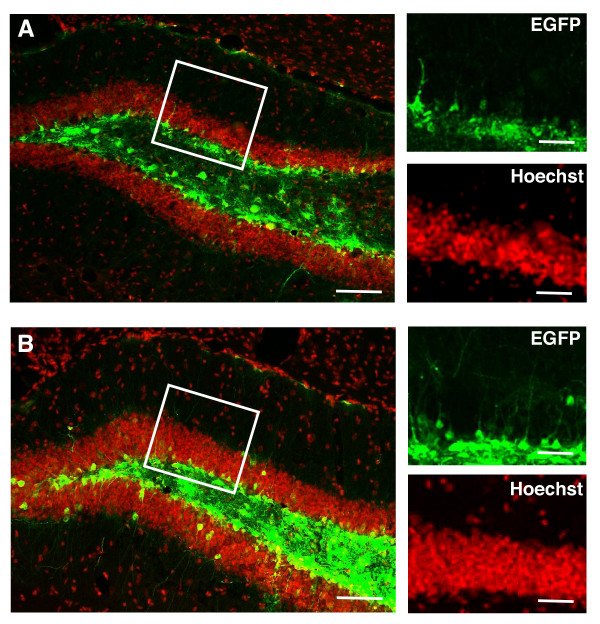
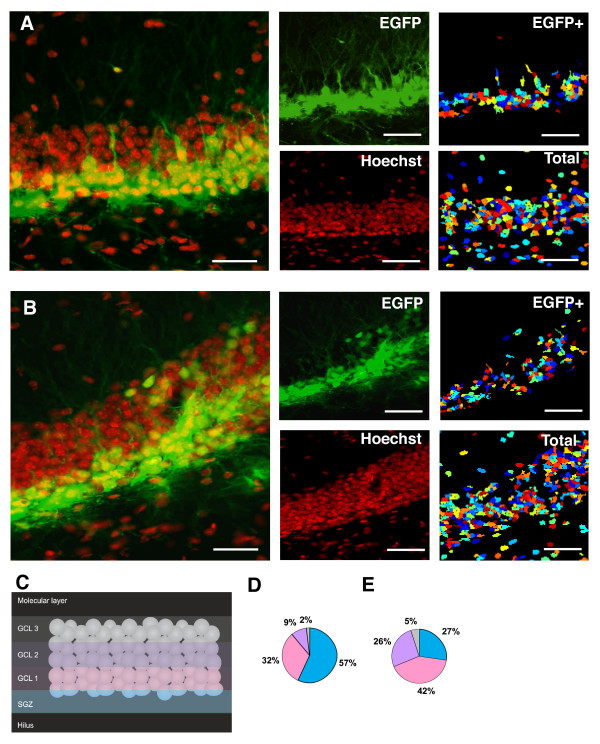
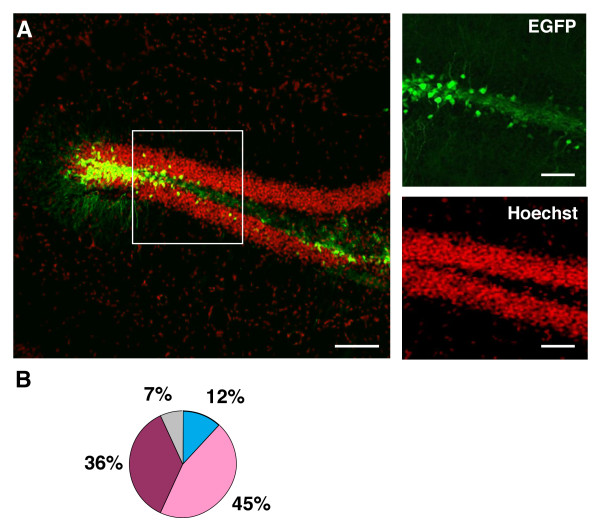
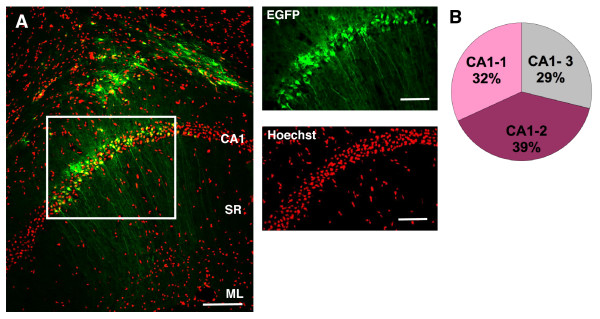
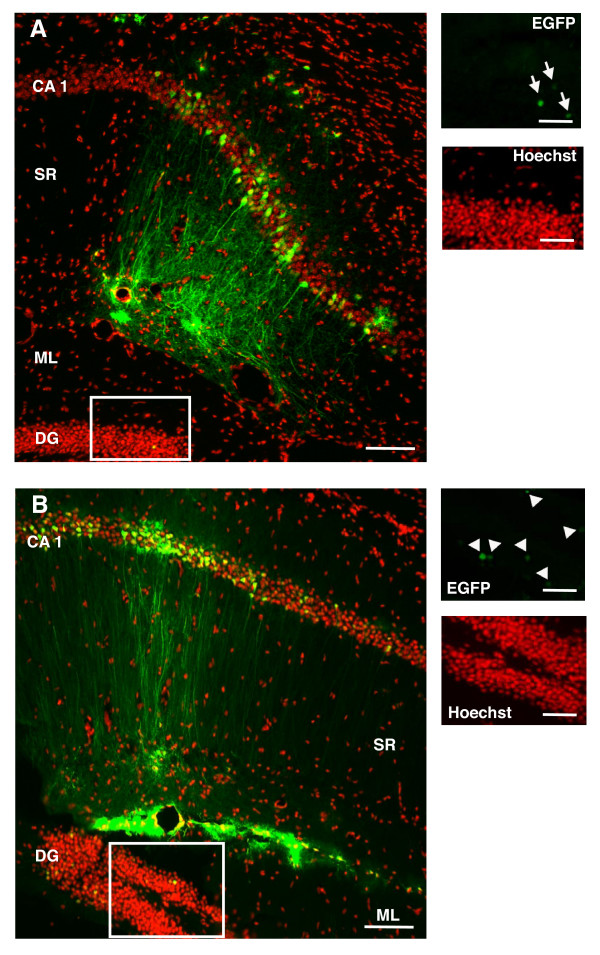
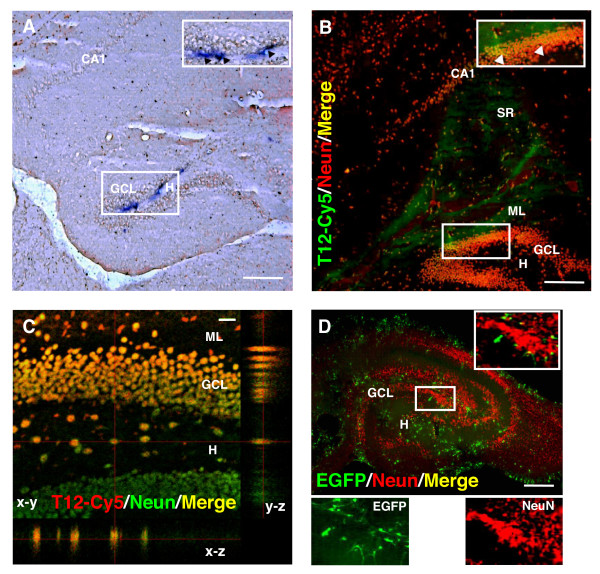
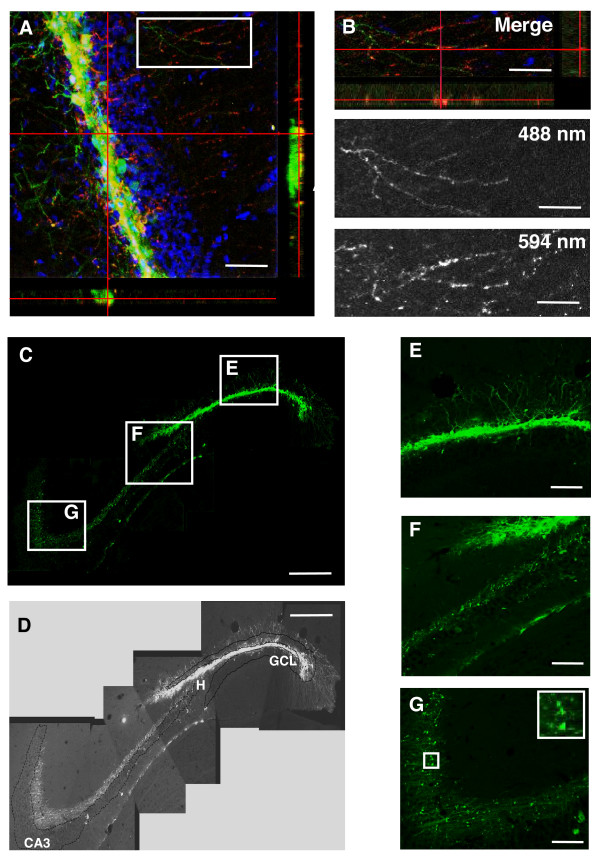
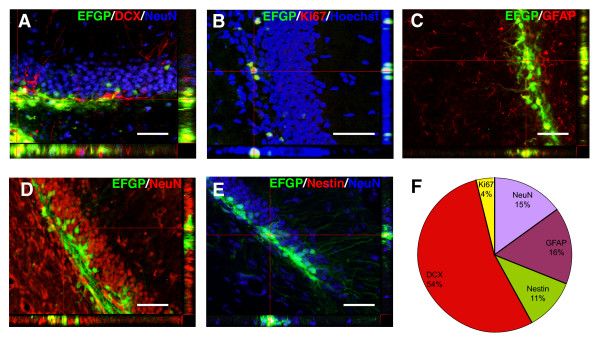
Results: In the present study we used Vesicular Stomatitis Virus G glycoprotein-pseudotyped lentivirual vectors to express EGFP from three different promoters in the mouse hippocampus. In contrast to lentiviral transduction of pyramidal cells in CA1, we identified sub-region specific differences in transgene expression in the granule cell layer of the dentate gyrus. Furthermore, we characterized the cell types transduced by these lentiviral vectors, showing that they target primarily neuronal progenitor cells and immature neurons present in the sub-granular zone and more immature layers of the granule cell layer.

Conclusion: Our observations suggest the existence of intrinsic differences in the permissiveness to lentiviral transduction among various hippocampal cell types. In particular, we show for the first time that mature neurons of the granule cell layer do not express lentivirus-delivered transgenes, despite successful expression in other hippocampal cell types. Therefore, amongst hippocampal granule cells, only adult-generated neurons are target for lentivirus-mediated transgene delivery. These properties make lentiviral vectors excellent systems for overexpression or knockdown of genes in neuronal progenitor cells, immature neurons and adult-generated neurons of the mouse hippocampus in vivo.


Figures

Figure 1
Figure 1
Lentivirus-mediated EGFP delivery to the DG. Lentivirus-mediated delivery by stereotaxic injections to the hilar region of the hippocampus does not results in substantial EGFP expression in the GCL, despite low (A) or high (B) EGFP expression, 1 week after injection. Each image shown is representative of 5 animals independently injected. Right panels represent the boxed area in the left panels of the figure. Scale bars: left panels 100 μm; right panels 20 μm.
Figure 2
Figure 2
EGFP+ cell location after injection with CMV-EGFP in the DG. Distribution of EGFP+ cells in the GCL 1 (A) or 5 (B) weeks after stereotaxic injection of CMV-EGFP. The central panels represent the split confocal channels shown merged in left panels. Right panels depict pseudo-colored cell-localization maps, used for quantitative image analyses, generated with Cell Profiler showing the automatically identified EGFP+ and total cells. Scale bars: 20 μm. Each image shown is representative of 5 animals independently injected. C, Schematic diagram depicting the subdivisions of the GCL used for quantitative image analyses, reproduced from [24], with permission from the authors. Distribution of EGFP+ cells within the GCL 1 (D) or 5 (E) weeks after the stereotaxic injection, normalized to the total number of EGFP+ cells. Each portion of the pie diagrams represents the mean percentage of EGFP+ within internal subdivisions shown in C, indicating the distribution across the GCL, color-coded according to (C).
Figure 3
Figure 3
EGFP+ cell location after injection with CamKII-EGFP in the DG. A: Distribution of EGFP+ cells in the GCL, 1 week after stereotaxic injection with CamKII-EGFP. Right panels represent the boxed area in the left panel of the figure. Scale bars: left panel 100 μm; right panels 20 μm. Each image shown is representative of 5 animals independently injected. B: Distribution of EGFP+ cells within the GCL 1 week after the stereotaxic injection, normalized to the total number of EGFP+ cells. Each portion of the pie diagram represents the mean percentage of EGFP+ within internal subdivisions of the GCL, color-coded according to (2C).
Figure 4
Figure 4
EGFP+ cell location in CA1 after injection with CMV-EGFP in the SR. A: Distribution of EGFP+ cells in CA1, 1 week after stereotaxic injection of CMV-EGFP to the SR. Right panels represent the boxed area in the left panel of the figure. Scale bars: left panel 100 μm; right panels 20 μm. Each image shown is representative of 5 animals independently injected. B: Distribution of EGFP+ cells within the CA1, 1 week after the stereotaxic injection, normalized to the total number of EGFP+ cells. Each portion of the pie diagram represents the mean percentage of EGFP+ within each internal subdivision of the CA1. SR: Stratum Radiatum; CA1: Cornu Ammonis 1; ML: Molecular layer; DG: Dentate Gyrus.
Figure 5
Figure 5
Lentivirus-mediated EGFP delivery to the SR. Lentivirus-mediated delivery by stereotaxic injections to the SR of the hippocampus does not result in substantial EGFP expression in the GCL, despite low (A) or high (B) EGFP expression, 1 week after injection. Right panels represent the boxed area in the left panels of the figure. Arrows (A) and arrowheads (B) indicate EGFP+ cells in the GCL. Scale bars: left panels 100 μm; right panels 20 μm. Each image shown is representative of 5 animals independently injected. SR: Stratum Radiatum; CA1: Cornu Ammonis 1; ML: Molecular layer; DG: Dentate Gyrus.
Figure 6
Figure 6
Transduction pattern of the CMV-EGFP lentivirus vector in the DG after delivery to the SR. A: In situ hybridization for EGFP mRNA in the GCL, 1 week after stereotaxic injection of CMV-EGFP to the SR. Inset: higher magnification view of the boxed area. Arrowheads indicate positive EGFP expression in the hilus and SGZ. B: Stereotaxic injection to the SR of a fluorescently labeled transferrin-derived peptide (T12-Cy5, pseudocolored green). NeuN+ cells are shown in red. Inset: higher magnification view of the boxed area. Arrowheads indicate NeuN+ cells in the outer GCL positively transduced with the fluorescent peptide (yellow). Animals were sacrificed 48 h after the injection. C: Higher magnification confocal image showing colocalization (yellow) of T12-Cy5 (red) and NeuN (green) in cells located across the suprapyramydal blade (top) hilus and infrapyramidal blade (bottom) of the DG. The orthogonal projection on the y-z axis shows a gradient of peptide expression from the ML to the H with highest expression in cells located in the outer GCL. D: CMV-EGFP transduction pattern in DIV-5 organotypic hippocampal slice cultures. Inset: higher magnification of the boxed area. The split panels at the bottom show the corresponding EGFP and NeuN signals from the same area. Note the almost complete lack of colocalization. Each image shown is representative of 5 animals independently injected. Scale bars: A, B and D: 100 μm; C: 10 μm. CA1: Cornu Ammonis 1, SR: Stratum Radiatum; ML: Molecular layer; GCL: Granule Cell Layer;H:Hilus; SGZ: Subgranular Zone.
Figure 7
Figure 7
Transduction pattern of the CMV-EGFP lentivirus in DG and CA3 by EGFP immunohistochemistry. A: Confocal microscope image and orthogonal projections onto the x-z (bottom) and y-z (right) planes showing co-localization (yellow) of the native EGFP fluorescence (green) and EGFP immunohistochemistry signal (red) in GC somata, one week after injection. B: Higher magnification of the boxed area depicted in A showing partial co-localization in dendrites of GC (top). The split panels corresponding to the EGFP native fluorescence signal (488 nm, center) and the EGFP immunohistochemistry signal (594 nm, bottom) are shown. C and D: Composite of 5 confocal z-projected stacks combining EGFP's native fluorescence and immunohistochemistry signal 5 weeks after injection, showing EGFP positive cells with their somata in the GCL (E) and projecting axons into the hilus (F) and the Stratum Lucidum of the CA3 field (G), were the synaptic boutons of these axons are evident (F and inset in G). Each image shown is representative of 5 animals independently injected. Scale bars: A: 40 μm; B: 25 μm; C: 200 μm; E; F and G: 10 μm. GCL: Granule Cell Layer, H:Hilus. CA3: Cornu Ammonis 3.
Figure 8
Figure 8
Identification and quantification of different cell types targeted by injection of CMV-EGFP in the DG. Examples of EGFP co-localization with different markers of neuronal differentiation within the GCL. The orthogonal projections onto the x-z (bottom) and y-z (right) planes of cells indicated by hairlines are shown to confirm double labeling throughout the extent of EGFP+ cells co-expressing DCX and NeuN (A); Ki67 (B); GFAP (C); NeuN (D) or Nestin and NeuN (E). Each image shown is representative of 5 animals independently injected. Scale bars: 20 μm. F: Percentual distribution of EGFP+ cells expressing differentiation markers within the GCL, 1 week after the stereotaxic injection normalized to the total number of EGFP+ cells.
Figure 9
Figure 9
Morphological analyses and three-dimensional reconstructions of EGFP+/NeuN+ cells in the GCL. Representative examples of EGFP+ neurons located in the GCL 1 week after the stereotaxic injection of CMV-EGFP. (A) Confocal image showing EGFP+ cells in the DG. The orthogonal projections onto the x-z (bottom) and y-z (right) planes are shown to confirm EGFP expression throughout the extent of the cells indicated with hairlines. (B) Z-axis projection of EGFP+ neurons from the area depicted in A, showing their morphological features. C and D: higher magnification of the areas boxed in B. E: three-dimensional reconstruction of the dendritic segment depicted in C, shown as example of those used for dendritic protrusion analyses. F: Three-dimensional reconstructions of two example EGFP+ GCL neurons, showing their dentritic arborization and length. Cell somata are shown in cyan and dendrites in red. Similar neurons were used for quantitative analyses. Scale bars: A: 50 μm; B, C, D, E: 10 μm; F: 100 μm. (Full-resolution animated 3D-reconstructions are available at ).

References

    1. Seress L, Pokorny J. Structure of the granular layer of the rat dentate gyrus. A light microscopic and Golgi study. J Anat. 1981;133:181–195. - PMC - PubMed
    1. Becker S, Wojtowicz JM. A model of hippocampal neurogenesis in memory and mood disorders. Trends Cogn Sci. 2007;11:70–76. - PubMed
    1. Aimone JB, Wiles J, Gage FH. Potential role for adult neurogenesis in the encoding of time in new memories. Nat Neurosci. 2006;9:723–727. - PubMed
    1. Suslov ON, Kukekov VG, Ignatova TN, Steindler DA. Neural stem cell heterogeneity demonstrated by molecular phenotyping of clonal neurospheres. Proc Natl Acad Sci USA. 2002;99:14506–14511. - PMC - PubMed
    1. Zhang CL, Zou Y, He W, Gage FH, Evans RM. A role for adult TLX-positive neural stem cells in learning and behaviour. Nature. 2008;451:1004–1007. - PubMed

Publication types

MeSH terms

Substances

LinkOut - more resources