. 2009 Mar 13;284(11):6725-34.
doi: 10.1074/jbc.M806893200. Epub 2009 Jan 14.

Activation of dual oxidases Duox1 and Duox2: differential regulation mediated by camp-dependent protein kinase and protein kinase C-dependent phosphorylation

Affiliations

Activation of dual oxidases Duox1 and Duox2: differential regulation mediated by camp-dependent protein kinase and protein kinase C-dependent phosphorylation

Sabrina Rigutto et al. J Biol Chem. .

Abstract

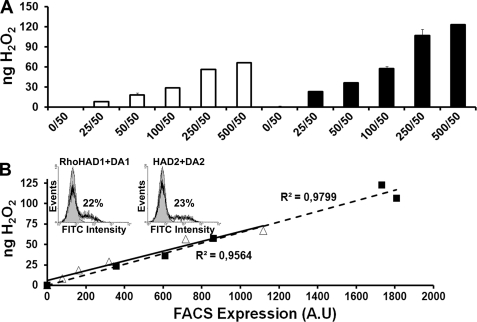
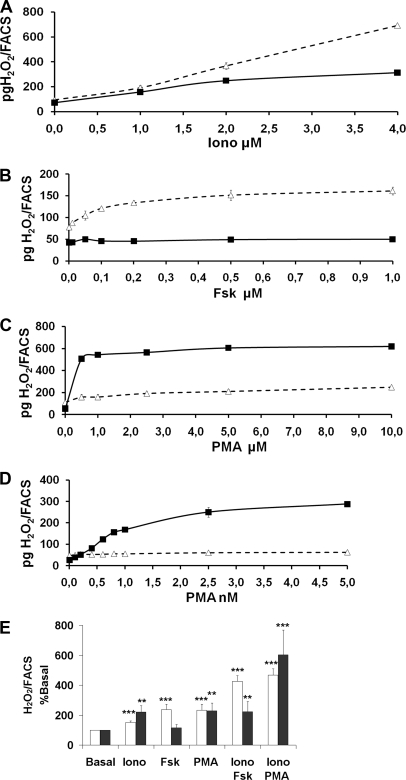
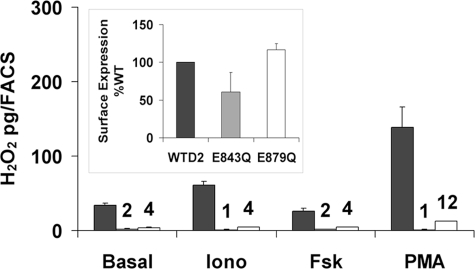
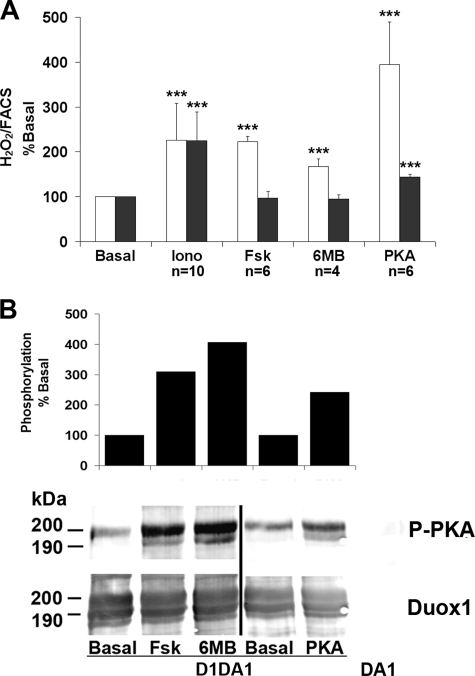
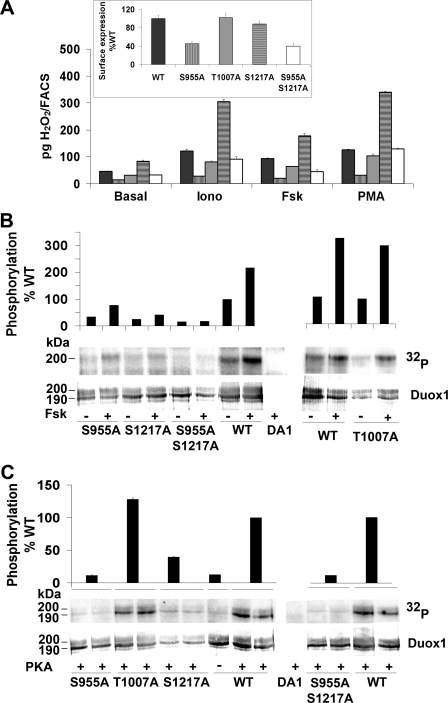
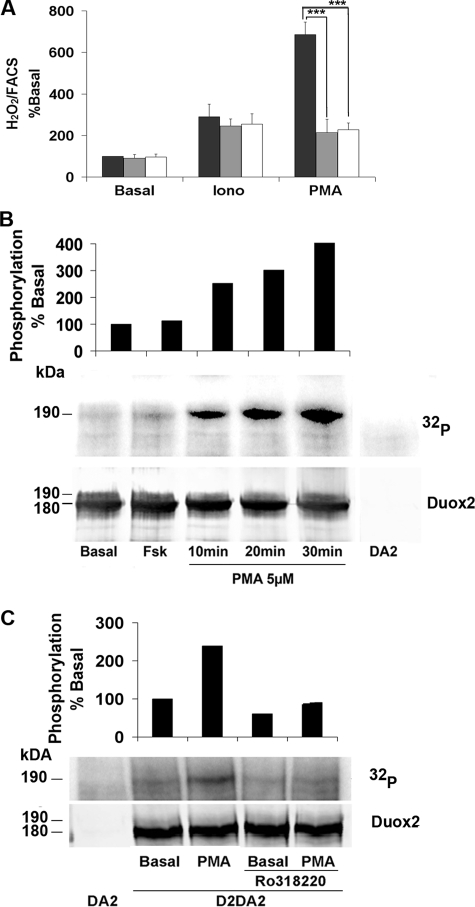
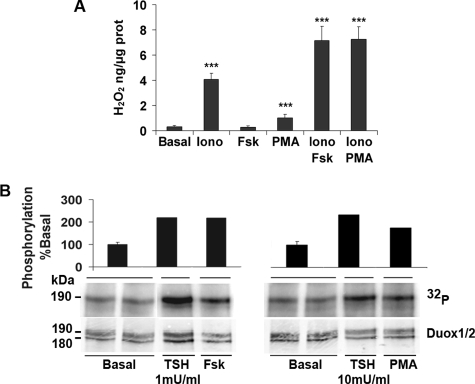
Dual oxidases were initially identified as NADPH oxidases producing H(2)O(2) necessary for thyroid hormone biosynthesis. The crucial role of Duox2 has been demonstrated in patients suffering from partial iodide organification defect caused by bi-allelic mutations in the DUOX2 gene. However, the Duox1 function in thyroid remains elusive. We optimized a functional assay by co-expressing Duox1 or Duox2 with their respective maturation factors, DuoxA1 and DuoxA2, to compare their intrinsic enzymatic activities under stimulation of the major signaling pathways active in the thyroid in relation to their membrane expression. We showed that basal activity of both Duox isoenzymes depends on calcium and functional EF-hand motifs. However, the two oxidases are differentially regulated by activation of intracellular signaling cascades. Duox1 but not Duox2 activity is stimulated by forskolin (EC(50) = 0.1 microm) via protein kinase A-mediated Duox1 phosphorylation on serine 955. In contrast, phorbol esters induce Duox2 phosphorylation via protein kinase C activation associated with high H(2)O(2) generation (phorbol 12-myristate 13-acetate EC(50) = 0.8 nm). These results were confirmed in human thyroid cells, suggesting that Duox1 is also involved in thyroid hormonogenesis. Our data provide, for the first time, detailed insights into the mechanisms controlling the activation of Duox1-2 proteins and reveal additional phosphorylation-mediated regulation.


Figures

FIGURE 1.
FIGURE 1.
Intrinsic activity of Duox isoenzymes in reconstituted systems. A, measurement of H2O2 accumulation (ng) produced by Duox1/DuoxA1 or Duox2/DuoxA2 co-transfected Cos-7 cells for 2.5 h in the presence of 1 μm ionomycin. Constant amount of DuoxA-Myc-pcDNA3.1 DNA (50 ng) was transfected with increasing DNA amounts of Rho-HA-Duox1-pcDNA3 (white) or HA-Duox2-pcDNA3.1 (black) (0–500 ng). Each measurement corresponds to a transfection experiment performed in duplicate (means ± S.D.). B, plot of H2O2 production against the relative Duox expression level at the cell surface. Membrane expression of Rho-HA-Duox1 (▵) and HA-Duox2 (▪) proteins were quantified by FACS using the anti-HA antibody (A.U, arbitrary unit of fluorescein isothiocyanate fluorescence intensity). Inset, representative histograms of a FACS experiment; the gray areas represent cells transfected with the Duox construct alone. The percentage of cells expressing Duox at the cell surface is indicated for each construct.
FIGURE 2.
FIGURE 2.
H2O2 generation in response to ionomycin, Fsk, or PMA. Measurement of H2O2 produced by Cos-7 cells co-expressing Rho-HA-Duox1/DuoxA1 (▵) or HA-Duox2/DuoxA2 (▪) for 2.5 h normalized to Duox membrane expression. The cells were stimulated during the 2.5-h period with increasing concentrations of ionomycin (A), Fsk (B), or PMA (C and D). Each measurement corresponds to a transfection experiment performed in duplicate (means ± S.D.). E, H2O2 production of Cos-7 cells co-expressing Rho-HA-Duox1/DuoxA1 (white) or HA-Duox2/DuoxA2 (black) stimulated during the 2.5-h period with 1 μm ionomycin in combination with 1 μm Fsk or PMA (5 μm for Duox1 and 0.5 nm for Duox2). H2O2 produced in basal condition was considered as 100% (means ± S.D., n = 4). Statistical significances compared with basal are indicated. **, p < 0.01; ***, p < 0.001.
FIGURE 3.
FIGURE 3.
Loss of Duox2 activity by mutations in EF-hand motifs. H2O2 accumulation was performed for 2.5 h at 37 °C in the presence of 1 μm ionomycin (Iono), 1 μm Fsk, or 1 nm PMA from cells expressing DuoxA2 with wild type (black), E843Q (gray), or E879Q (white) HA-Duox2. The graphs show the means ± S.D. (n = 4). Expression of mutated Duox2 constructs at the cell surface relative to WT is shown in the inset.
FIGURE 4.
FIGURE 4.
cAMP-dependent activation of Duox1. A, Cos-7 cells expressing Rho-HA-Duox1/DuoxA1 (white) or HA-Duox2/DuoxA2 (black) were stimulated for 2.5 h with 1 μm ionomycin (Iono), 1 μm Fsk, or 50 μm 6-MB-cAMP corresponding to the time of H2O2 accumulation. In the PKA condition, cells transfected with a third vector coding for the PKA catalytic subunit. H2O2 production was normalized to Duox cell surface expression, and the resulting specific activities are expressed relative to the basal condition (set to 100). The data are shown as the values ± S.D. for n indicated measurements (***, p < 0.001). B, immunodetection of Duox1 phosphorylation mediated by agents activating the cAMP cascade. The cells were treated for 30 min with either 1 μm Fsk or 50 μm 6-MB-cAMP. After anti-Duox immunoprecipitation, PKA phosphorylation was immunodetected with the anti-RXX(pS/pT) antibody (P-PKA) and total Duox1 with anti-Duox polyclonal antibody. In the top panel, the columns represent PKA-mediated Duox1 phosphorylation corrected to the total amount of immunoprecipitated Duox1. The level of phosphorylation is expressed relative to the basal phosphorylation set to 100. The PKA condition was performed in a different experiment from Fsk and 6-MB-cAMP (6MB).
FIGURE 5.
FIGURE 5.
Identification of PKA-mediated phosphorylation sites in Duox1. A, Duox1 activity. Cos-7 cells expressing DuoxA1 in combination with WT (black bars), S955A (vertically hatched bars), T1007A (gray bars), S1217A (horizontally hatched bars), or S955A/S1217A (open bars) Rho-HA-Duox1 were stimulated for 2.5 h with 1 μm ionomycin (Iono), 1 μm Fsk, or 5 μm PMA and H2O2 accumulation normalized to Duox membrane expression. The inset shows the cell surface expression for each constructs relative to WT Duox1. The graph corresponds to one representative experiment from four independent experiments (means ± S.D., n = 2). B, Duox1 phosphorylation. Cells expressing DuoxA1 with WT or mutant Rho-HA-Duox1 were 32P-labeled and treated for 30 min with either 1 μm Fsk (+) or solvent (–). In the top panel, relative densitometry of phosphorylated Duox1 corrected to the total Duox1 immunoprecipitated (non stimulated WT Duox1 considered as 100%). C, in vitro phosphorylation of Duox1 by PKA. Each construct was tested in duplicate. The relative Duox1 phosphorylation corrected to the total amount of Duox1 is showed on the top of the figure.
FIGURE 6.
FIGURE 6.
PMA stimulates the activity and phosphorylation of Duox2. A, cells co-transfected with HA-Duox2/DuoxA2 were preincubated 30 min in Krebs-Ringer-Hepes medium containing vehicle (black bars) or PKC inhibitors: 1 μm Ro318220 (gray bars) or 1 μm Gö6976 (open bars) before 2.5 h of stimulation with 1 μm ionomycin (Iono) or 1 nm PMA. H2O2 accumulation was normalized to Duox2 expression at the plasma membrane. The level of H2O2 is represented as a percentage of the value obtained in basal condition without PKC inhibitor (means ± S.D., n = 6). Statistically significant inhibition is indicated. ***, p < 0.001. B, phosphorylation by 32P incorporation measured after 10, 20, or 30 min of treatment with 5 μm PMA. On the top of the Western blot, the relative amount of phosphorylated Duox2 corrected to total Duox2 protein (basal phosphorylation was considered as 100%). C, inhibition of PMA-mediated Duox2 phosphorylation by Ro318220. The cells were preincubated or not with 1 μm Ro318220 before stimulated with 100 nm PMA. Total Duox2 proteins were detected with anti-Duox antibody, and the relative Duox2 phosphorylation corrected to total Duox2 protein is represented at the top of the figure (basal phosphorylation without PKC inhibitor was considered as 100%).
FIGURE 7.
FIGURE 7.
H2O2 measurement and Duox phosphorylation in human thyrocytes. A, cells were incubated 90 min at 37 °C with 1 μm ionomycin (Iono), 10 μm Fsk, or 5 μm PMA. The peroxide production was normalized to the total amount of proteins. The graphs show means ± S.D. of three independent experiments performed in duplicate (***, p < 0.001). B, Duox1–2 phosphorylation after stimulation by TSH, Fsk, and PMA. Thyrocytes were stimulated 30 min with 1 milliunits/ml TSH or 10 μm Fsk or 5 min with 10 milliunits/ml TSH or 5 μm PMA. Quantification of Duox phosphorylation corrected to total immunoprecipitated protein represented at the top. Basal condition performed in duplicate.

References

    1. Dupuy, C., Ohayon, R., Valent, A., Noel-Hudson, M. S., Deme, D., and Virion, A. (1999) J. Biol. Chem. 274 37265–37269 - PubMed
    1. De Deken, X., Wang, D., Many, M. C., Costagliola, S., Libert, F., Vassart, G., Dumont, J. E., and Miot, F. (2000) J. Biol. Chem. 275 23227–23233 - PubMed
    1. Lambeth, J. D. (2004) Nat. Rev. Immunol. 4 181–189 - PubMed
    1. Babior, B. M. (1999) Blood 93 1464–1476 - PubMed
    1. Banfi, B., Clark, R. A., Steger, K., and Krause, K. H. (2003) J. Biol. Chem. 278 3510–3513 - PubMed

Publication types

MeSH terms