. 2009 Mar;101(3):1575-87.
doi: 10.1152/jn.91106.2008. Epub 2009 Jan 14.

Striatal versus hippocampal representations during win-stay maze performance

Affiliations

Striatal versus hippocampal representations during win-stay maze performance

Joshua D Berke et al. J Neurophysiol. 2009 Mar.

Abstract

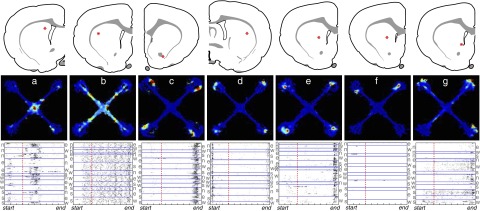
The striatum and hippocampus are widely held to be components of distinct memory systems that can guide competing behavioral strategies. However, some electrophysiological studies have suggested that neurons in both structures encode spatial information and may therefore make similar contributions to behavior. In rats well trained to perform a win-stay radial maze task, we recorded simultaneously from dorsal hippocampus and from multiple striatal subregions, including both lateral areas implicated in motor responses to cues and medial areas that work cooperatively with hippocampus in cognitive operations. In each brain region, movement through the maze was accompanied by the continuous sequential activation of sets of projection neurons. Hippocampal neurons overwhelmingly were active at a single spatial location (place cells). Striatal projection neurons were active at discrete points within the progression of every trial-especially during choices or following reward delivery-regardless of spatial position. Place-cell-type firing was not observed even for medial striatal cells entrained to the hippocampal theta rhythm. We also examined neural coding in earlier training sessions, when rats made use of spatial working memory to guide choices, and again found that striatal cells did not show place-cell-type firing. Prospective or retrospective encoding of trajectory was not observed in either hippocampus or striatum, at either training stage. Our results indicate that, at least in this task, dorsal hippocampus uses a spatial foundation for information processing that is not substantially modulated by spatial working memory demands. By contrast, striatal cells do not use such a spatial foundation, even in medial subregions that cooperate with hippocampus in the selection of spatial strategies. The progressive dominance of a striatum-dependent strategy does not appear to be accompanied by large changes in striatal or hippocampal single-cell representations, suggesting that the conflict between strategies may be resolved elsewhere.


Figures

FIG. 1.
FIG. 1.
Win-stay task and behavioral performance. A: plus-maze arrangement (to scale). Thirsty rats ran continuously between water ports at the arm ends. As the rat approached the central zone on each trial, one pair of lights began flashing to indicate which arm choice would be rewarded. B: acquisition of continuous win-stay task. Solid black line indicates mean (±SE) overall performance for each of the first 10 training days. Gray and dashed lines show the same data divided into “conflict trials” (in which rats were cued to return to the arm they came from on the immediately preceding trial) and the rest (“nonconflict”). Note that rats were initially reluctant to quickly revisit locations, but after extended training they ignored their recent choice history; n = 8 (all rats for which conflict/nonconflict data were recorded; see Supplemental Fig. S1 for individual animal data).
FIG. 2.
FIG. 2.
Place cells in hippocampus but not striatum. A: examples of projection neurons in striatum (panels a–g) and dorsal CA1 (panels h–n). Striatal locations are indicated with an asterisk on the corresponding coronal atlas section (Swanson 1992). For each cell, the “north” arm is shown at top right in the firing map. The number above the firing map to the left is the spatial asymmetry index (0–1; higher = more asymmetrical) and the number to the right is the maximum of the firing-rate color scale (in Hz; unvisited locations are shown in black). Examples were chosen to illustrate the full range of the asymmetry values for each population. Below each firing map is a raster plot showing activity on each trial as a function of position on the linearized path between trial start and trial end. Dashed redline = point of cue light onset. Trials are sorted by trajectory: {n, e, w, s} indicate {north, east, west, south} arms, respectively, for both start and end locations. B: histogram of spatial asymmetry index values for all unique striatal (n = 109) and hippocampal (n = 95) projection cells recorded during well-practiced performance. C: histogram of arm selectivity ratios (see methods) for all striatal and hippocampal neurons with firing fields on an arm; bin size = 10. Inset: distribution for ratios <10; bin size = 1. Note that all striatal neurons had low arm selectivity ratios. D: spatial asymmetry vs. location within striatum. No significant relationship was observed between asymmetry and distance from midline (left; P = 0.262, 95% confidence limits for r = [−0.289 0.270]) or distance from the anterior-medial-ventral tip of the striatum (right; “origin” = AP 3.13 mm, ML 0; DV 8.0 mm relative to bregma; P = 0.545; 95% confidence limits for r = [−0.243 0.132]). E: no significant correlation (P = 0.695) between the spatial asymmetry of striatal medium spiny projection neurons (MSNs) and the precision of their entrainment to hippocampal theta rhythm (measured as the length of the mean phase vector r, range 0–1).
FIG. 3.
FIG. 3.
Egocentric/motor-related activity in striatum but not hippocampus. A: examples of individual neurons that showed differential activity on straight, left, and right turn trials. Top panels show firing rate maps; middle plots show raster of spike events along the linearized path for each trial, arranged by trial type; and bottom panels show histograms of the same data, normalized to the maximum counts in any path bin. For these examples (striatal, hippocampal), total number of trials = (103, 135), firing map color scale maxima = (41, 33) Hz and egocentricity scores = (10.7, 4.6), respectively. In the hippocampal case, differential activity arises due to a place field in the center of the maze; only on select straight trials does the rat pass directly through the place field. B: significance values for all path bins for each of the striatal (left) and hippocampal (right) projection neurons, sorted by egocentricity score (indicated by color scale). Red lines indicate the approximate portion of the path for which the rat paths showed clear divergence on left, right, and straight trials. Note that the high significance bins were concentrated within this path portion. C: histogram of peak significance values for each cell. Note that the striatal distribution shows a long tail of high significance values, whereas the hippocampal distribution does not.
FIG. 4.
FIG. 4.
Temporal evolution and classification of striatal, hippocampal activity. A: individual activity of all projection neurons (one per line) in hippocampus (top) and striatum (bottom). Firing rates are shown with a normalized color scale (zero to peak rate for that neuron), as a function of time relative to instruction cue onset (left) or arrival at the reward port (middle), or as a function of position along the linearized path between trial start and end (right). Neurons are sorted by point of peak activity. The time between cue and reward varied between approximately 2 and 4 s; the mean of the session means was 3.09 s. Note the kink in the striatal distributions at the reward point, where many MSNs increased firing rate; no such kink is seen at the cue onset. B: population activity around the same events, measured as the average firing rate of all projection cells (with each cell's rate normalized to its own mean; shaded area shows overall SE). Top panel shows corresponding average running speed. C: average firing rate maps for the hippocampal (left) and striatal (right) projection cell populations. Color scale is normalized for each population, with maximum values of 1.7 Hz (hippocampus) and 2.3 Hz (striatum). D: no significant correlation (r2 = 0.0227) between the location along the linearized path of peak MSN firing and location within striatum, measured as the distance from the same anterior/ventral/medial origin point as in Fig. 2. E: functional classification of striatal and hippocampal projection neurons (see methods). The same classification criteria were applied to both neuronal populations. “Task-stage” refers to cells with symmetrical firing fields on all 4 arms (that were not also egocentric). Numbers in italics indicate absolute numbers of cells assigned to each category. F: proportion of each class of striatal MSN that was entrained (P < 0.01) to theta rhythm (recorded in hippocampal CA1 pyramidal layer). Colors are as in E. Numbers indicate entrained/nonentrained cells in each class; numbers are lower than those in E because not all striatal neurons were recorded simultaneously with CA1 theta rhythm.
FIG. 5.
FIG. 5.
Striatal single-unit representations are similar at early to later stages of learning. Layout is like that in Fig. 2. Panels a–g: examples of individual neuron firing patterns and their corresponding locations within striatum, recorded when rats were using both win-stay and win-shift strategies (see main text). Panels a–e are representative units; panels f and g show notable exceptions. As seen at later stages of learning, all parts of the maze were associated with the activity of subpopulations of striatal neurons. As for other striatal neurons that were preferentially active in the maze center, the neuron shown in panel a showed significant egocentricity—in this case firing less on right-turn trials (n-w, e-n, w-s, s-e) than that on other trials. Panel f: illustrates how apparently place-specific activity can arise when the variability between trials is not considered. Candidate “place fields” are visible on 2 of the maze arms, but inspection of the raster plots indicates that each arose from a strong burst of activity occurring only on a single trial. The neuron shown in panel g was the only striatal neuron to be classified as a “place cell” by the classification algorithm, but it is in fact active in 3 of the 4 arms.

References

    1. Ainge JA, Tamosiunaite M, Woergoetter F, Dudchenko PA. Hippocampal CA1 place cells encode intended destination on a maze with multiple choice points. J Neurosci 27: 9769–9779, 2007. - PMC - PubMed
    1. Apicella P, Scarnati E, Ljungberg T, Schultz W. Neuronal activity in monkey striatum related to the expectation of predictable environmental events. J Neurophysiol 68: 945–960, 1992. - PubMed
    1. Becker JT, Walker JA, Olton DS. Neuroanatomical bases of spatial memory. Brain Res 200: 307–320, 1980. - PubMed
    1. Berke JD Uncoordinated firing rate changes of striatal fast-spiking interneurons during behavioral task performance. J Neurosci 28: 10075–10080, 2008. - PMC - PubMed
    1. Berke JD Procedural learning: striatum. In: Encyclopedia of Neuroscience, edited by Squire LR. Oxford: Academic, 2009.

Publication types