. 2009 Jan 14;29(2):313-27.
doi: 10.1523/JNEUROSCI.4093-08.2009.

Abnormal network activity in a targeted genetic model of human double cortex

Affiliations

Abnormal network activity in a targeted genetic model of human double cortex

James B Ackman et al. J Neurosci. .

Abstract

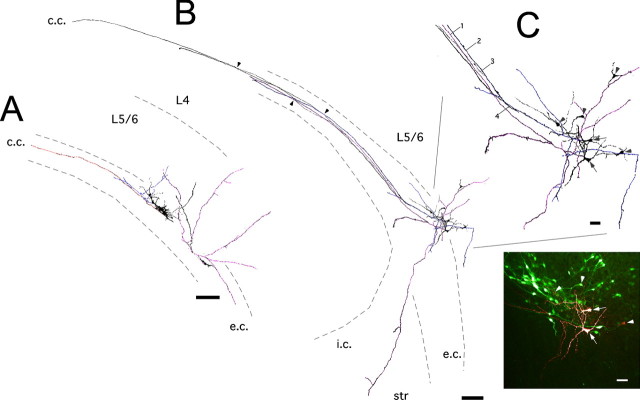
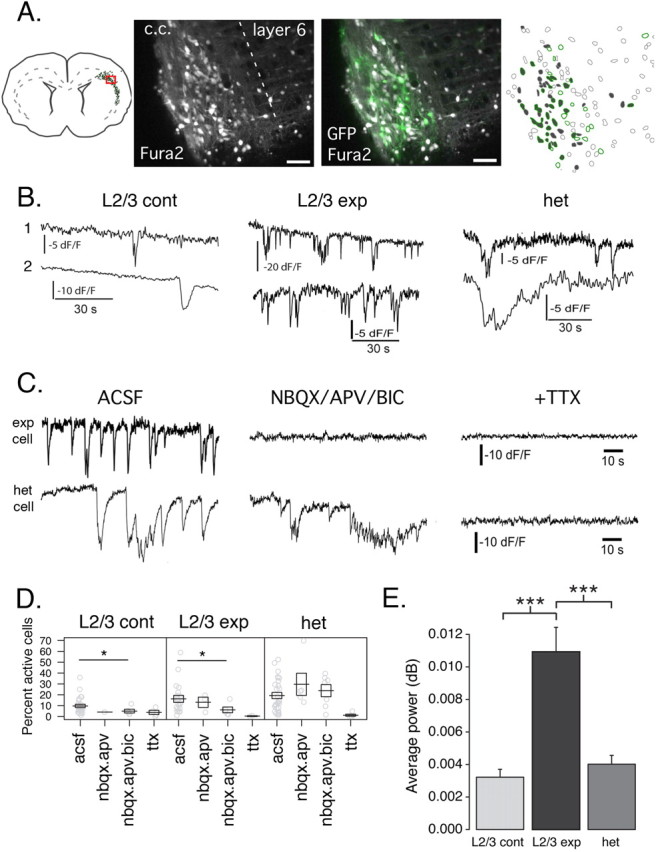
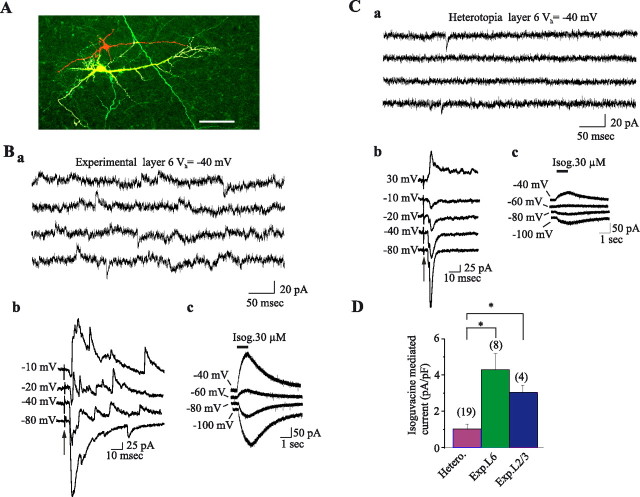
In human patients, cortical dysplasia produced by Doublecortin (DCX) mutations lead to mental retardation and intractable infantile epilepsies, but the underlying mechanisms are not known. DCX(-/-) mice have been generated to investigate this issue. However, they display no neocortical abnormality, lessening their impact on the field. In contrast, in utero knockdown of DCX RNA produces a morphologically relevant cortical band heterotopia in rodents. On this preparation we have now compared the neuronal and network properties of ectopic, overlying, and control neurons in an effort to identify how ectopic neurons generate adverse patterns that will impact cortical activity. We combined dynamic calcium imaging and anatomical and electrophysiological techniques and report now that DCX(-/-)EGFP(+)-labeled ectopic neurons that fail to migrate develop extensive axonal subcortical projections and retain immature properties, and most of them display a delayed maturation of GABA-mediated signaling. Cortical neurons overlying the heterotopia, in contrast, exhibit a massive increase of ongoing glutamatergic synaptic currents reflecting a strong reactive plasticity. Neurons in both experimental fields are more frequently coactive in coherent synchronized oscillations than control cortical neurons. In addition, both fields displayed network-driven oscillations during evoked epileptiform burst. These results show that migration disorders produce major alterations not only in neurons that fail to migrate but also in their programmed target areas. We suggest that this duality play a major role in cortical dysfunction of DCX brains.


Figures

Figure 1.
Figure 1.
Heterotopia formation by DCX RNAi. A, RNAi of DCX protein expression by in utero electroporation of a plasmid encoding a DCXshRNA. Electroporation of the ventricular zone with EGFP + DCXshRNA plasmids (EGFP + DCX RNAi) at E16 inhibits neuronal migration and results in formation of a band of EGFP+ ectopic neurons in the white matter, whereas electroporation of EGFP plasmid alone results in EGFP+ layer 2/3 pyramidal neurons. B, NeuN labeling within an EGFP+ heterotopia. Notice the presence of colabeling of EGFP+ ectopic neurons with NeuN in a single confocal z-section. Also notice the presence of NeuN-positive EGFP-negative (untransfected) neurons, which are likely retained within the heterotopia by a cell-population effect as described previously (Ramos et al., 2006). Scale bar, 50 μm. C, D, F, G, Confocal images of rat cerebral cortex after either control (EGFP only) electroporation (C, F) or EGFP + DCXshRNA electroporation (D, G). A subcortical band heterotopia has formed in the corpus callosum (c.c.). In contrast to the radial orientation and pyramidal morphology of EGFP+ neurons in layer 2/3, ectopic neurons in the white matter are tangentially oriented with elongated bipolar or multipolar morphologies. Scale bars: C, D, 100 μm; F, G, 50 μm. E, The staining of biocytin-filled ectopic neurons (red) from whole-cell recordings reveals the colabeling of EGFP (green) for both of the patched cells. Scale bar, 25 μm. H, I, Pattern of discharge of two different EGFP+ ectopic neurons representative of 72% (H) and 28% (I) of ectopic recorded neurons recorded with a KM2SO4-based pipette solution. The discharge was evoked either by depolarizing steps (left) or by progressive injection of currents (right).
Figure 2.
Figure 2.
Axonal arborizations of ectopic cortical neurons. A, Reconstructions of biocytin-filled ectopic neurons. EGFP+ ectopic neurons were targeted for whole-cell recordings with biocytin-containing patch pipettes. Axonal arbors emanating from different neurons are colored (orange, blue, and magenta). Notice axons from ectopic neurons coursing callosally and ventrally within the white matter. Scale bar, 200 μm. B, Additional examples of ectopic neurons. Axonal arbors from the two patched neurons in this slice are colored (blue and magenta). Notice axonal collaterals coursing within the white matter, cortex, and striatum/internal capsule. Also notice two biocytin-filled axons in the callosum (black, arrows 3, 4) that did not emanate from the patched neurons (also see supplemental Movie S1, available at www.jneurosci.org as supplemental material). C, Enlargement of drawings shown in B; inset displays the corresponding confocal picture. Arrows depict patched neurons double stained with EGFP and Cy3; arrowheads point to nonpatched but biocytin-positive neurons: they are transfected or nontransfected cells, the latter likely retained within the heterotopia by a cell-population effect as described previously (Ramos et al., 2006). Scale bars: 200 μm; (inset) 50 μm. c.c., Corpus callosum; e.c., external capsule; i.c., internal capsule; str, striatum.
Figure 3.
Figure 3.
Distribution of GABAergic and glutamatergic terminals in DCX animals. A–N, Immunostaining with GAD65/67 (left panels) and vGlut1 (right panels) antibodies of cortical sections. Pictures were taken from representative control L2/3 (A, C), experimental L2/3 (B, D), control corpus callosum (E, G), and white matter heterotopia (F, H–N). Color pictures (I–N) illustrate the presence of GABA (I–K) and glutamate (L–N) terminals (in red) around cell bodies and dendrites (in green) of ectopic neurons. Insets in I and L are enlarged in J–K and M–N, respectively; the contours of somatodendritic elements of green cells were delineated in J and K for a better appreciation of the distribution of immunopositive elements. O, Bar graphs depict GAD immunoreactivity levels on the different fields. P, Bar graphs depict vGlut1 immunoreactivity levels on the different fields. Notice that vGlut1 immunoreactivity in heterotopia is significantly lower than in control L2/3 and DCX L2/3 (mean values of 4–6 animals ± SEM; *p = 0.005, t test). Scale bars, 10 μm.
Figure 4.
Figure 4.
Spontaneous activity in heterotopic networks during postnatal development. A, Identification and calcium indicator loading of the heterotopic network. An EGFP+ heterotopia was identified in a coronal slice from a P3 rat and loaded with the calcium indicator fura-2 AM. Shown are single z-sections of the EGFP and fura-2 signals under two-photon excitation (middle). Contour outlines of the fura-2-loaded somas are shown in the right panel. Filled contours (gray) indicate neurons displaying spontaneous calcium transients during a 100 s optical recording. EGFP+ neurons are indicated with green outlines. Scale bars, 50 μm. c.c., Corpus callosum. B, Examples of calcium fluorescence traces from neurons in the control L2/3, experimental cortex L2/3, and heterotopia. Top and bottom traces are examples of two different cells from recordings in each network. C, Synaptic (top)- and nonsynaptic (bottom)-mediated activity in L2/3 experimental and heterotopic networks, respectively. The example recordings of L2/3 experimental and ectopic neurons are from the same slice of a P10 animal. Traces represent the same cells monitored before and after drug application. Longer-duration nonsynaptic-type calcium events persist in the presence of glutamatergic and GABAergic antagonists (NBQX/APV/BIC) but are sensitive to TTX (top traces) in the heterotopia in contrast to shorter-duration synaptically driven transients (bottom traces) recorded in experimental L2/3. D, Strip plots of the percentage of active cells in control L2/3, experimental L2/3, and heterotopic networks in control conditions (ACSF) or in the presence of glutamate receptor antagonists NBQX and APV or glutamate receptor antagonists plus GABAA receptor antagonist bicuculline (nbqx.apv.bic) or TTX. Gray circles represent the percentage of active cells per slice. Means and ±1 SEM are represented by black boxes. *p < 0.05, Wilcoxon rank sum. E, Bar plot summarizing the average signal power (integrated spectral power) for all active cells on the interval [0, 3.5 Hz]. ***p < 0.0001, pairwise t test. contL2/3, n = 222 cells; expL2/3, n = 521; het, n = 441.
Figure 5.
Figure 5.
Correlated population events within the heterotopic and experimental L2/3 networks. A, Event duration histogram (top) and raster plot (bottom) from optical recordings of control L2/3 (left), experimental L2/3 (middle), and heterotopia from the same experimental slice (right). Histograms depict the percentage of imaged cells that are detected as being active at each movie frame, and raster plots indicate for each recorded neuron the times at which it displays calcium transients and their durations (horizontal lines). Experimental L2/3 and heterotopic networks have a significant increase in cells participating in correlated spontaneous calcium events with respect to the control L2/3 network. B, Population coherence in heterotopic and experimental L2/3 networks. Each circle represents the percentage of correlated cells within and during an optical recording. Means and ±1 SEM are represented by black boxes. Although the application of receptor antagonists significantly reduced the neuronal correlation in experimental L2/3, it failed to induce any significant change in the heterotopia. **p < 0.0078, Wilcoxon rank sum.
Figure 6.
Figure 6.
Spontaneous synaptic activity in heterotopia is dominated by glutamate. A, Example traces of ongoing spontaneous activity recorded at −70 mV (ECl) and −40 mV in a pyramidal cell of control L2/3 (left traces), experimental L2/3 (middle traces), and white matter heterotopia (right traces). Note the large increase of glutamate PSCs in the pyramidal cell from experimental L2/3 compared with control. Note in the ectopic cell the low level of activity and the absence of GABA PSCs. B, Mean GABA (Ba) and glutamate (Glu; Bb) PSC frequencies in L2/3 pyramidal neurons from control, mismatch (Mism), and DCX slices, and in ectopic cells. The numbers of recorded cells are given in parentheses. Bc, Glutamate/GABA PSC frequency ratio in the first three populations of cells. Values indicated in the histogram correspond to the mean of the ratio of Glu to GABA PSC frequency of each individual cell (the number of cells is given in parentheses). Note that the ongoing spontaneous activity in pyramidal cell from experimental L2/3 is largely dominated by glutamate. Most of the ectopic neurons (73%) lack GABA events, but the 15 displaying both GABA and glutamate PSC presented a mean Glu/GABA PSC frequency ratio of 1.8 ± 0.6. C, Histogram representing the EPSC size distribution in pyramidal cells recorded in control layer 2/3 (837 events, n = 3), experimental layer 2/3 (837 events, n = 4), and heterotopia (817 events, n = 7). Nb, Number. *Significantly different as compared to Cont.L2/3 or Mism.L2/3.
Figure 7.
Figure 7.
Lack of functional GABA synapses in ectopic cells. A, Confocal image of two biocytin-injected (red) patch-clamp-recorded neurons from experimental L6. One of them is a transfected (green) ectopic neuron, and the other is not. Scale bar, 50 μm. Ba, Spontaneous synaptic activity of the EGFP-negative layer VI neuron (calibration bar same as in Ca). Bb, Synaptic responses evoked in the same cell by electrical stimulation of deep cortical layers (50 V, 30 μs duration; the artifact of stimulation is indicated by an arrow) at different membrane potentials. Note that both spontaneous and evoked responses are composed of inward and outward currents at membrane potentials more positive than −70 mV, indicating that synaptic responses are mediated by GABA and glutamate receptors. Bc, Currents evoked in the same cell by pressure ejection of isoguvacine (Isog; 30 μm, 1 s, 1 psi) at different membrane potentials. Ca–Cc, Same types of recordings as in B of an EGFP+ ectopic neuron. Ca, Note the presence of fast transient inward currents and the absence of any fast transient outward currents, indicating that the spontaneous activity is mediated only by glutamate receptors. Cb, Synaptic responses evoked in the same cell by electrical stimulation of deep cortical layers (same conditions as described in B). Note that the responses are always inward at potentials more positive than −70 mV, indicating that they are mediated only by glutamate (even higher stimulus intensity, up to 100 V, failed to evoke any outward current at these membrane potentials). Cc, Currents evoked in the same cell by pressure ejection of isoguvacine (30 μm, 1 s, 1 psi) at different membrane potentials. Note that these currents are lower than in a normotopic cell. D, Mean current amplitude evoked by pressure ejection of isoguvacine (30 μm, 1 s) at −40 mV expressed in picoamperes per picofarad in ectopic L6 neurons (mean capacitance: 33 ± 2 pF), nonectopic L6 neurons (experimental L6, mean capacitance: 59 ± 10 pF), and experimental L2/3 neurons (mean capacitance: 35 ± 6 pF). Note that ectopic cells display 3–4 times less currents than nonectopic cells, which display functional GABA synapses. Whole-cell pipettes were filled with a CsGlu internal solution. *p < 0.004.
Figure 8.
Figure 8.
Ectopic neurons participate in cortical network activity. A, Concomitant field potential (F.P.) recording of experimental L2/3 and patch-clamp recording of an ectopic cell at −40 mV holding potential. A single electrical stimulation of L2/3 (40 V, 30 μs) evokes responses that are blocked by ionotropic glutamate receptor antagonists (NBQX, 10 μm; d-APV, 40 μm). The remaining population spike in the field is blocked by TTX (1 μm). B, Coincident spontaneous recurrent activities recorded in experimental L2/3 (field potential) and an ectopic neuron (patch clamp at a holding potential of −40 mV). Each of these recurrent network events is shown at an expanded time scale below the continuous trace. C, Mg2+-free ACSF solution generates epileptiform activities in the population of experimental L2/3 neurons associated with a barrage of glutamatergic PSCs in an ectopic cell recorded at −40 mV. One burst is shown at a higher time scale below the continuous trace, and one of the events in the burst (marked with an asterisk) is shown at an expanded time scale on the right. Note that the onset of the field potential in L2/3 (labeled with a dashed line) starts before the onset of the ectopic cell. D, Histogram representing the difference in the latency of the onset of the field and of the PSCs of each event within the burst. Note that for almost half of the events, the onset of the field starts at the same time as the PSCs, whereas in the majority of events, L2/3 is active before the ectopic cell. The ectopic cell is active before the field (negative latency) in only a few cases. Nb, Number.

References

    1. Alcamo EA, Chirivella L, Dautzenberg M, Dobreva G, Fariñas I, Grosschedl R, McConnell SK. Satb2 regulates callosal projection neuron identity in the developing cerebral cortex. Neuron. 2008;57:364–377. - PubMed
    1. Bai J, Ramos RL, Ackman JB, Thomas AM, Lee RV, LoTurco JJ. RNAi reveals doublecortin is required for radial migration in rat neocortex. Nat Neurosci. 2003;6:1277–1283. - PubMed
    1. Britanova O, de Juan Romero C, Cheung A, Kwan KY, Schwark M, Gyorgy A, Vogel T, Akopov S, Mitkovski M, Agoston D, Sestan N, Molnár Z, Tarabykin V. Satb2 is a postmitotic determinant for upper-layer neuron specification in the neocortex. Neuron. 2008;57:378–392. - PubMed
    1. Cahana A, Escamez T, Nowakowski RS, Hayes NL, Giacobini M, von Holst A, Shmueli O, Sapir T, McConnell SK, Wurst W, Martinez S, Reiner O. Targeted mutagenesis of Lis1 disrupts cortical development and LIS1 homodimerization. Proc Natl Acad Sci U S A. 2001;98:6429–6434. - PMC - PubMed
    1. Calcagnotto ME, Paredes MF, Baraban SC. Heterotopic neurons with altered inhibitory synaptic function in an animal model of malformation-associated epilepsy. J Neurosci. 2002;22:7596–7605. - PMC - PubMed

Publication types

MeSH terms

Substances

LinkOut - more resources