. 2009 Jan 14;29(2):359-70.
doi: 10.1523/JNEUROSCI.2760-08.2009.

Saturated fatty acids produce an inflammatory response predominantly through the activation of TLR4 signaling in hypothalamus: implications for the pathogenesis of obesity

Affiliations

Saturated fatty acids produce an inflammatory response predominantly through the activation of TLR4 signaling in hypothalamus: implications for the pathogenesis of obesity

Marciane Milanski et al. J Neurosci. .

Abstract

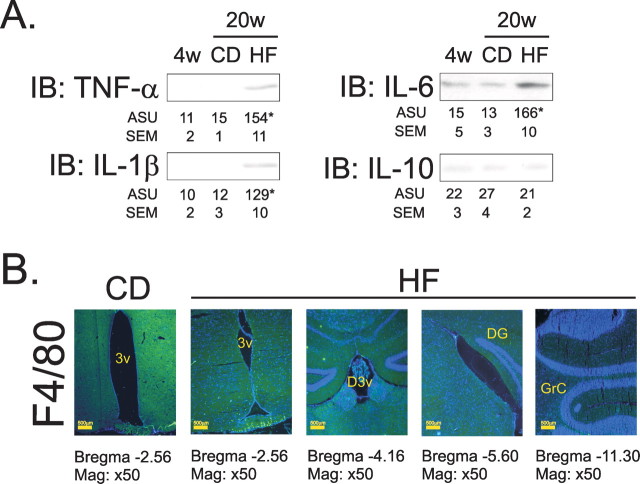
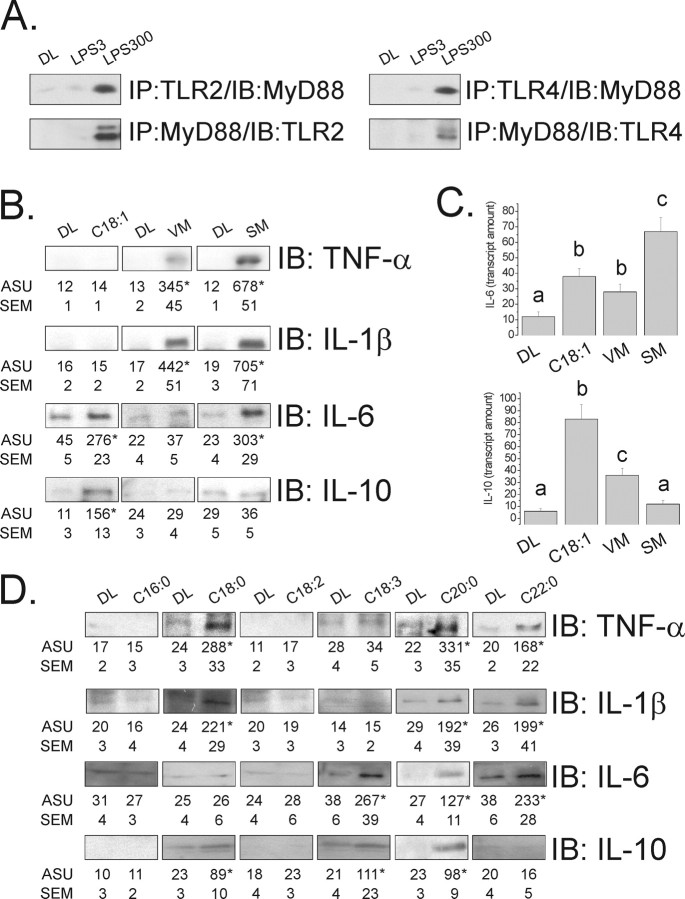
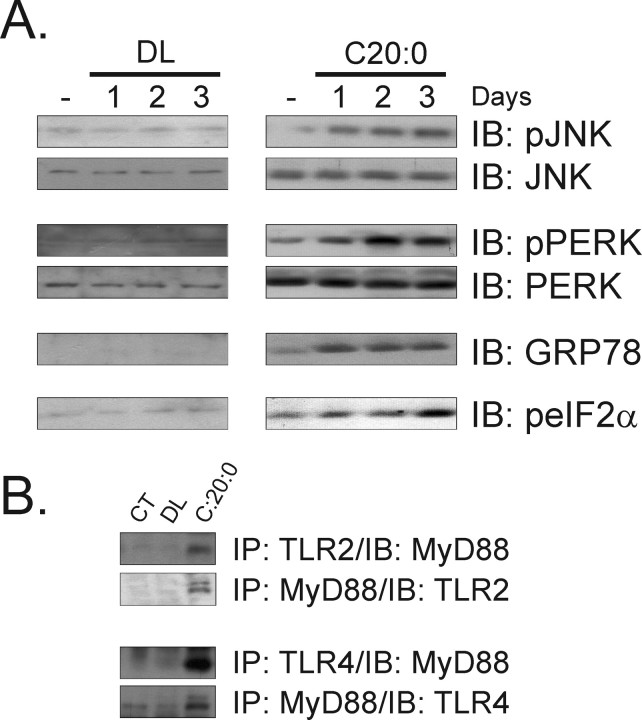
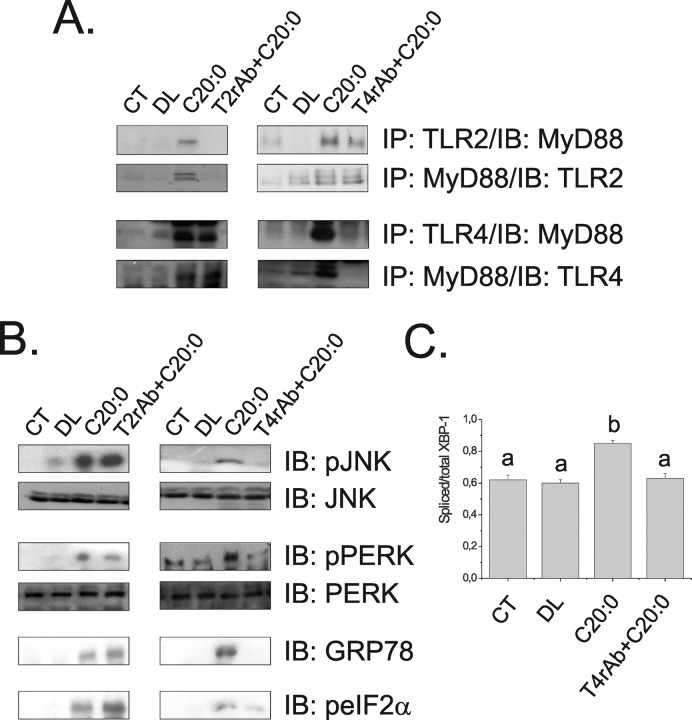
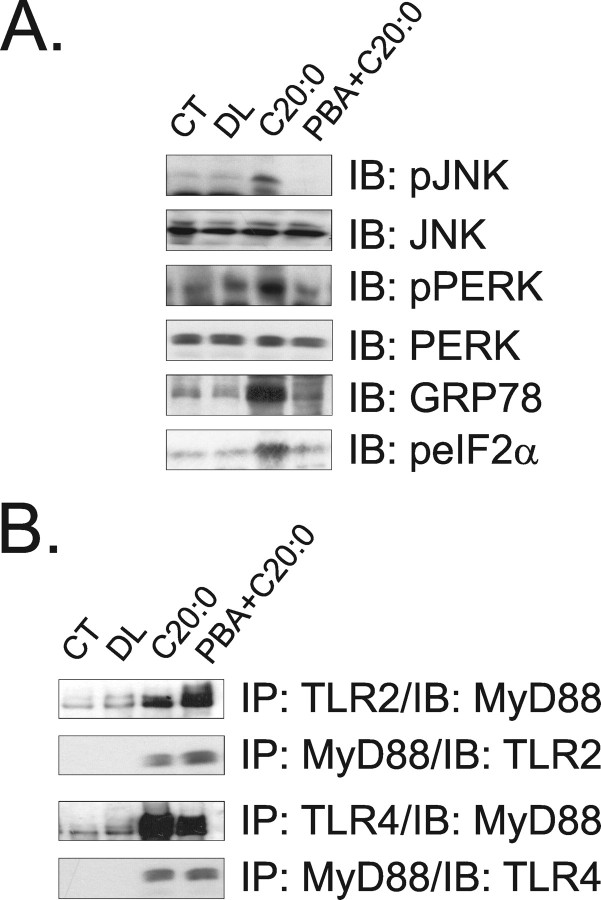
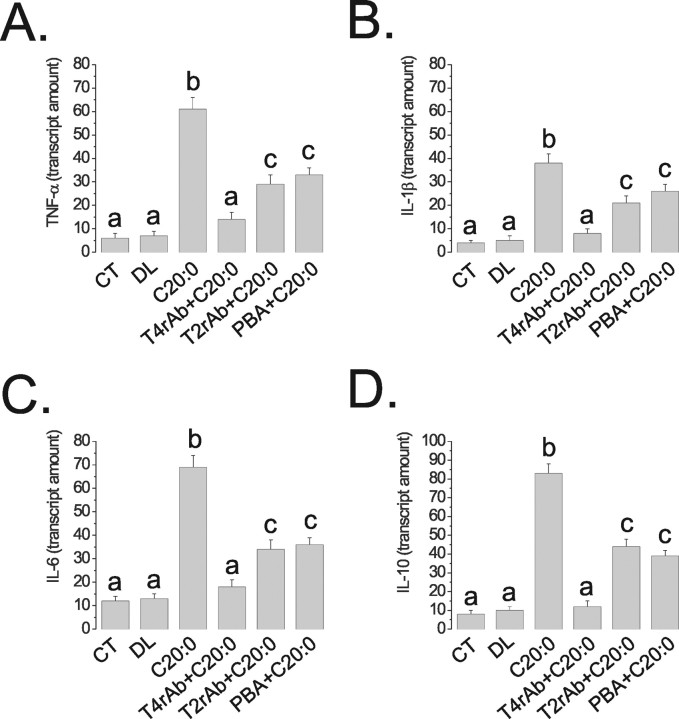
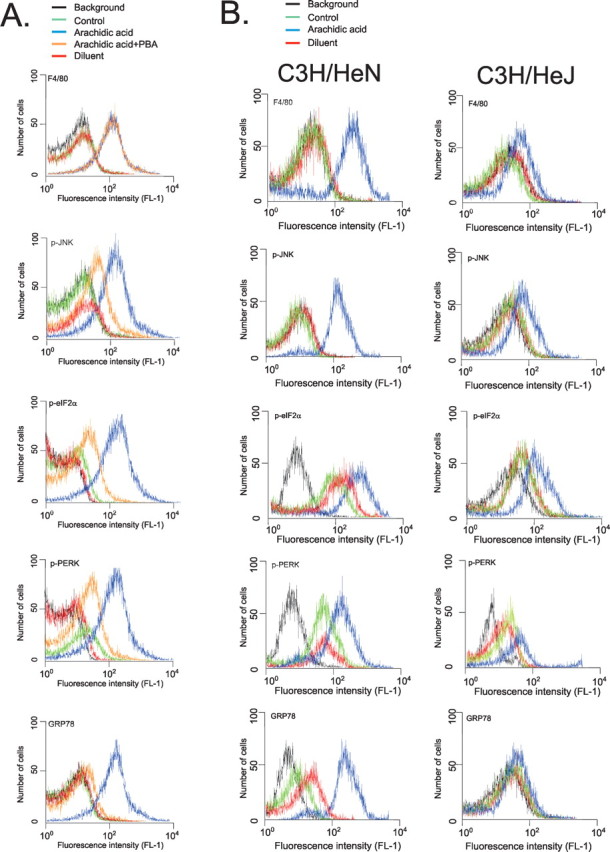
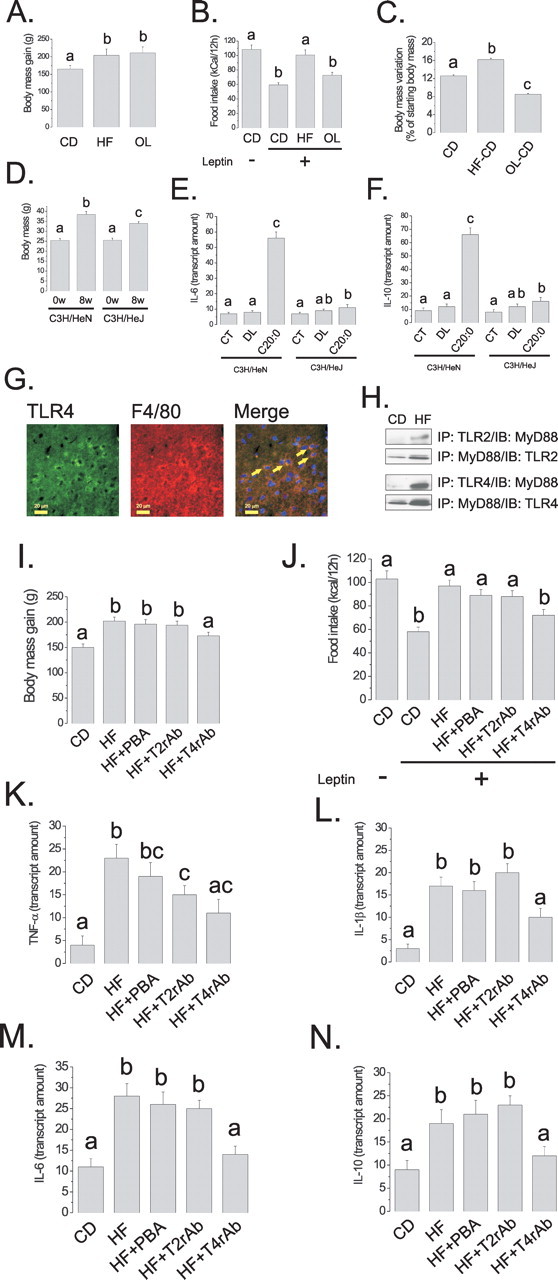
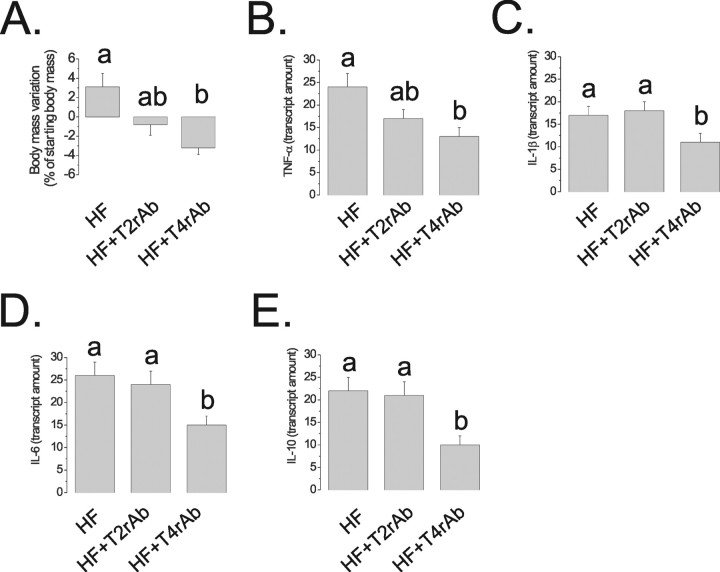
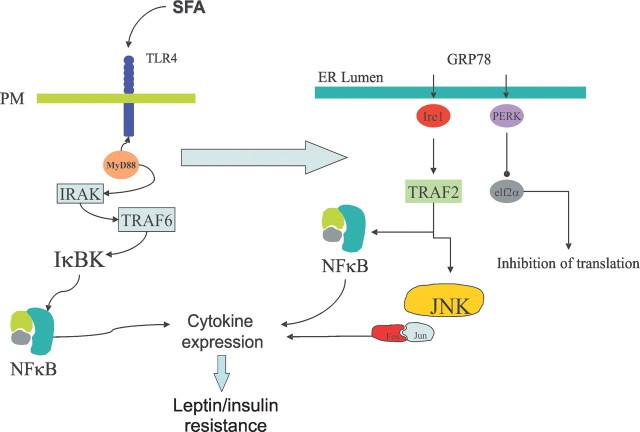
In animal models of diet-induced obesity, the activation of an inflammatory response in the hypothalamus produces molecular and functional resistance to the anorexigenic hormones insulin and leptin. The primary events triggered by dietary fats that ultimately lead to hypothalamic cytokine expression and inflammatory signaling are unknown. Here, we test the hypothesis that dietary fats act through the activation of toll-like receptors 2/4 and endoplasmic reticulum stress to induce cytokine expression in the hypothalamus of rodents. According to our results, long-chain saturated fatty acids activate predominantly toll-like receptor 4 signaling, which determines not only the induction of local cytokine expression but also promotes endoplasmic reticulum stress. Rats fed on a monounsaturated fat-rich diet do not develop hypothalamic leptin resistance, whereas toll-like receptor 4 loss-of-function mutation and immunopharmacological inhibition of toll-like receptor 4 protects mice from diet-induced obesity. Thus, toll-like receptor 4 acts as a predominant molecular target for saturated fatty acids in the hypothalamus, triggering the intracellular signaling network that induces an inflammatory response, and determines the resistance to anorexigenic signals.


Figures

Figure 1.
Figure 1.
A, Immunoblot (IB) analysis of expression of TNF-α, IL-1β, IL-6, and IL-10 in hypothalamic protein extracts obtained from 4 (4 w)- and 20 (20 w)-week old rats fed on CD and HF diets for 16 weeks, starting at 4 weeks of age. B, Immunofluorescence staining of F4/80 in the CNS of rats fed on CD and HF diets for 16 weeks; representative microphotographs were obtained from hypothalamic periventricular (3v) zone, in the first and second panels from the left; dorsal third ventricular (D3v) zone, in the third panel from the left; dentate gyrus zone (DG), in the fourth panel from the left; and granular layer of cerebellum, in the fifth panel from the left. In A, n = 5; results are presented as arbitrary scanning units (ASU) ±SEM, *p < 0.05 versus respective control. B, Microphotographs are representative of three distinct experiments; nuclei are stained with DAPI.
Figure 2.
Figure 2.
A, Immunoprecipitation/immunoblot (IP/IB) analysis of the associations of TLR2 and TLR4 with MyD88 in hypothalamic protein extracts obtained from rats treated intracerebroventricularly with diluent (DL), 3.0 ng LPS (LPS3), or 300 ng LPS (LPS300) for 3 d. B, Immunoblot (IB) analysis of expression of TNF-α, IL-1β, IL-6, and IL-10 in hypothalamic protein extracts obtained from rats treated intracerebroventricularly with diluent (DL), oleic acid (C18:1), VM (as presented in Materials and Methods), or SM (as presented in Materials and Methods). C, Real-time PCR determination of IL-6 and IL-10 mRNA expression in hypothalamic samples obtained from rats treated intracerebroventricularly with diluent (DL), oleic acid (C18:1), VM or SM. D, Immunoblot analysis of expressions of TNF-α, IL-1β, IL-6, and IL-10 in hypothalamic protein extracts obtained from rats treated intracerebroventricularly with diluent (DL), palmytic acid (C16:0), stearic acid (C18:0), linoleic acid (C18:2), linolenic acid (C18:3), arachidic acid (C20:0), and behenic acid (C22:0). In all experiments, n = 5; in B and D, results are presented as arbitrary scanning units (ASU) ±SEM, *p < 0.05 versus respective control; in C, results are presented as transcript amount, and different letters refer to significant differences between groups, p < 0.05.
Figure 3.
Figure 3.
A, Immunoblot (IB) analysis of the expressions of pJNK, JNK, pPERK, PERK, GRP78, and peIF2α in hypothalamic protein extracts obtained from rats treated intracerebroventricularly with diluent (DL) or arachidic acid (C20:0) for 1–3 d; some rats were intracerebroventricularly cannulated but received no treatment (−). B, Immunoprecipitation (IP) analysis of the associations of TLR2 and TLR4 with MyD88 in hypothalamic protein extracts obtained from nonintracerebroventricular cannulated (CT) rats, and rats treated intracerebroventricularly with DL or C20:0 for 3 d. The depicted blots are representative of five distinct experiments.
Figure 4.
Figure 4.
A, Immunoprecipitation (IP) analysis of the associations of TLR2 and TLR4 with MyD88 in hypothalamic protein extracts obtained from rats not intracerebroventricularly cannulated (CT), and rats treated intracerebroventricularly with diluent (DL), arachidic acid (C20:0), TLR2 receptor antibody plus arachidic acid (T2rAb+C20:0) or TLR4 receptor antibody plus arachidic acid (T4rAb+C20:0) for 3 d. B, Immunoblot (IB) analysis of expression of pJNK, JNK, pPERK, PERK, GRP78 and peIF2α in hypothalamic protein extracts. C, PCR analysis of spliced/total XBP-1 transcripts in hypothalamic samples. In A and B, the depicted blots are representative of five distinct experiments; in C, n = 5; different letters mean significant differences between groups, p < 0.05.
Figure 5.
Figure 5.
A, Immunoblot (IB) analysis of expression of pJNK, JNK, pPERK, PERK, GRP78, and peIF2α in hypothalamic protein extracts obtained from rats not intracerebroventricularly cannulated (CT), and from rats treated intracerebroventricularly with diluent (DL), arachidic acid (C20:0), or PBA plus arachidic acid (PBA+C20:0) for 3 d. B, Immunoprecipitation (IP) analysis of the associations of TLR2 and TLR4 with MyD88 in hypothalamic protein extracts obtained from rats treated as described in A. The depicted blots are representative of five distinct experiments.
Figure 6.
Figure 6.
Real-time PCR determination of TNF-α (A), IL-1β (B), IL-6 (C), and IL-10 (D) mRNA expressions in hypothalamic samples obtained from rats nonintracerebroventricularly canulated (CT), or treated intracerebroventricularly with diluent (DL), arachidic acid (C20:0), TLR4 receptor antibody plus arachidic acid (T4rAb+C20:0), TLR2 receptor antibody plus arachidic acid (T2rAb+C20:0) or PBA plus arachidic acid (PBA+C20:0) for 3 d. The results are presented as transcript amount, n = 5, and different letters mean significant differences between groups, p < 0.05.
Figure 7.
Figure 7.
Flow cytometry analysis of expressions of F4/80, p-JNK, p-elf2α, p-PERK, and GRP78 in isolated macrophages. A, Macrophages from C3H/HeN mice were plated and incubated for 16 h in the presence of arachidic acid (blue), arachidic acid plus PBA (orange) or diluent (red). After harvesting, the cells were incubated with specific primary antibodies and then labeled with secondary conjugated antibody. Signal detection was performed by flow cytometry. B, Macrophages from C3H/HeN and C3H/HeJ mice were plated and incubated for 16 h in the presence of arachidic acid (blue) or diluent (red). After harvesting, the cells were incubated with specific primary antibodies and then labeled with secondary conjugated antibody. Signal detection was performed by flow cytometry. Graphs are representative of n = 5. Background counts (black); control, not added primary antibody (green).
Figure 8.
Figure 8.
A–C, Rats were fed on CD, HF, or OL diets for 8 weeks; body mass variation (A) was determined during the experimental period. At the end of the experimental period, rats were treated intraperitoneally with saline (100 μl) (−) or a similar volume of leptin (10−6 m) (+), and spontaneous food intake was determined over 12 h (B). After 8 weeks on either diet, HF and OL rats were reallocated to CD diet for a further 4 weeks, and body mass variation was determined (C). D, C3H/HeN and C3H/HeJ mice were fed on a saturated-rich high-fat diet for 8 weeks, and body mass was determined in the first (0w) and last days (8w) of the experimental periods. E, F, Real-time PCR determination of IL-6 (E) and IL-10 (F) mRNA expressions in hypothalamic samples obtained from C3H/HeN and C3H/HeJ mice nonintracerebroventricularly canullated (CT), or treated intracerebroventricularly with diluent (DL) or arachidic acid (C20:0). G, Double-immunofluorescence staining of TLR4 and F4/80 in the arcuate nucleus of rats fed on high-fat diet for 8 weeks, the arrows depict double-positive cells. H, Immunoprecipitation (IP) analysis of the associations of TLR2 and TLR4 with MyD88 in hypothalamic protein extracts obtained from rats fed on CD or HF diets for 8 weeks. I, J, Rats were fed on CD or HF diets for 8 weeks. Throughout the period, the rats were treated with a daily intraperitoneal dose of PBA (HF+PBA), TLR2-inhibiting antibody (HF+T2rAb), or TLR4-inhibiting antibody (HF+T4rAb). Body mass variation (I) was determined. At the end of the experimental period, rats were treated intraperitoneally with saline (100 μl) (−) or a similar volume of leptin (10−6 m) (+), and spontaneous food intake was determined over 12 h (J). K–N, Real-time PCR determination of TNF-α (K), IL-1β (L), IL-6 (M) and IL-10 (N) mRNA expressions in hypothalamic samples obtained from rats treated according to the same protocol as for I, J. In all experiments, except G, n = 5; different letters mean significant differences between groups, p < 0.05. G, Microphotographs are representative of three distinct experiments; nuclei are stained with DAPI. The depicted blots are representative of five distinct experiments.
Figure 9.
Figure 9.
A, Rats were fed on high-fat diet for 8 weeks. During the last 7 d of the protocol, the rats were intracerebroventricularly treated with saline (HF), TLR2-inhibiting antibody (HF+T2rAb), or TLR4-inhibiting antibody (HF+T4rAb). Body mass change was measured over the 7 d (A). At the end of the experimental period, hypothalami were obtained for real-time PCR analysis of TNF-α (B), IL-1β (C), IL-6 (D), and IL-10 (E) mRNA determination. In all experiments, n = 5; different letters mean significant differences between groups, p < 0.05.
Figure 10.
Figure 10.
Proposed mechanism for saturated fatty acid (SFA)-induced activation of inflammatory response in hypothalamus. Initially, SFA activates predominantly TLR4, engaging MyD88. The classical downstream signaling through IRAK/TRAF6/NFkB (not tested in the present study) leads to cytokine expression. Through a hitherto unknown mechanism, TLR4 activation induces ER stress, which boosts cytokine expression enhancing the inhibitory signals of anorexigenic hormone action.

References

    1. Akira S. Toll-like receptor signaling. J Biol Chem. 2003;278:38105–38108. - PubMed
    1. Akira S, Uematsu S, Takeuchi O. Pathogen recognition and innate immunity. Cell. 2006;124:783–801. - PubMed
    1. Araújo EP, De Souza CT, Ueno M, Cintra DE, Bertolo MB, Carvalheira JB, Saad MJ, Velloso LA. Infliximab restores glucose homeostasis in an animal model of diet-induced obesity and diabetes. Endocrinology. 2007;148:5991–5997. - PubMed
    1. Bertelli DF, Araújo EP, Cesquini M, Stoppa GR, Gasparotto-Contessotto M, Toyama MH, Felix JV, Carvalheira JB, Michelini LC, Chiavegatto S, Boschero AC, Saad MJ, Lopes-Cendes I, Velloso LA. Phosphoinositide-specific inositol polyphosphate 5-phosphatase IV inhibits inositide trisphosphate accumulation in hypothalamus and regulates food intake and body weight. Endocrinology. 2006;147:5385–5399. - PubMed
    1. Brooks CC. Fatty acid composition of pork lipids as affected by basal diet, fat source and fat level. J Anim Sci. 1971;33:1224–1231. - PubMed

Publication types

MeSH terms