. 2009 Jan 14;29(2):476-82.
doi: 10.1523/JNEUROSCI.4117-08.2009.

Functional and morphological differences among intrinsically photosensitive retinal ganglion cells

Affiliations

Functional and morphological differences among intrinsically photosensitive retinal ganglion cells

Tiffany M Schmidt et al. J Neurosci. .

Abstract

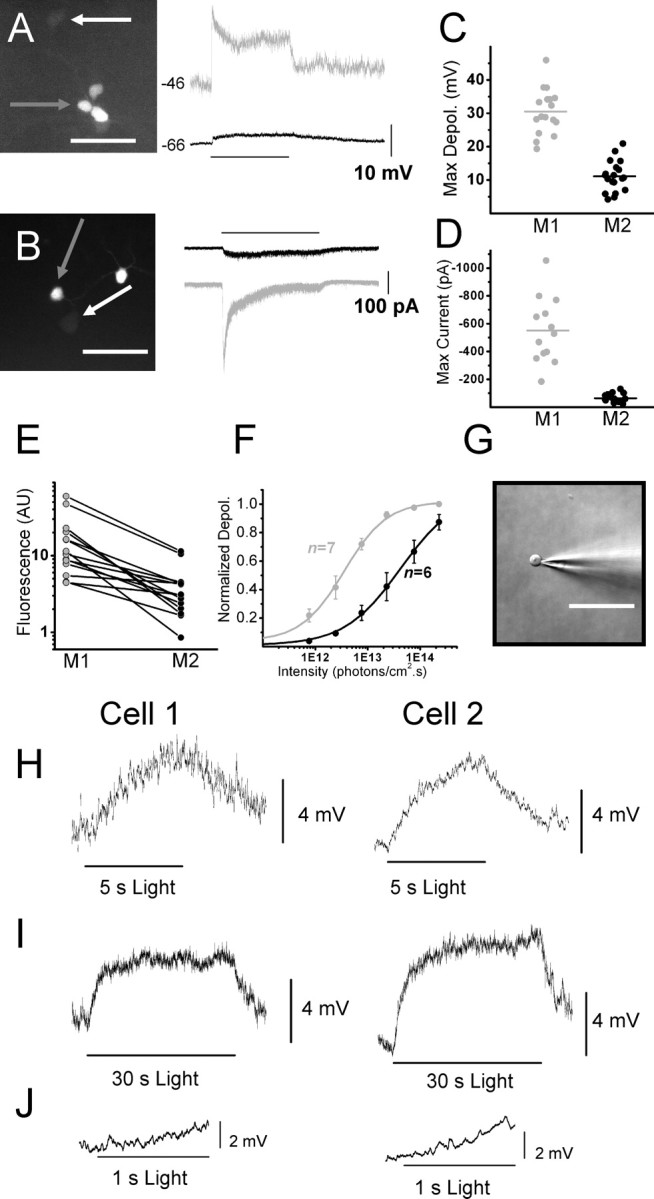
A subset of ganglion cells in the mammalian retina express the photopigment melanopsin and are intrinsically photosensitive (ipRGCs). These cells are implicated in non-image-forming visual responses to environmental light, such as the pupillary light reflex, seasonal adaptations in physiology, photic inhibition of nocturnal melatonin release, and modulation of sleep, alertness, and activity. Morphological studies have confirmed the existence of at least three distinct subpopulations of ipRGCs, but studies of the physiology of ipRGCs at the single cell level have focused mainly on M1 cells, the dendrites of which stratify solely in sublamina a (OFF sublamina) of the retinal inner plexiform layer (IPL). Little work has been done to compare the functional properties of M1 cells to those of M2 cells, the dendrites of which stratify solely in sublamina b (ON sublamina) of the IPL. The goal of the current study was to compare the morphology, intrinsic light response, and intrinsic membrane properties of M1 and M2 cells in the mouse retina. Here we demonstrate additional morphological differences between M1 and M2 cells as well as distinct physiological characteristics of both the intrinsic light responses and intrinsic membrane properties. M2 cells displayed a more complex dendritic arborization and higher input resistance, yet showed lower light sensitivity and lower maximal light responses than M1 cells. These data indicate morphological and functional heterogeneity among ipRGCs.


Figures

Figure 1.
Figure 1.
Morphological characteristics of M1 and M2 cells. A1, B1, Whole-mount retinas of M1 and M2 cells filled with Neurobiotin (green) and immunostained for ChAT (red), a cholinergic amacrine cell marker. A1, M1 cell with dendrites stratifying solely in sublamina a of the IPL. A2, Tracings of M1 cells to show dendritic morphology. B1, M2 cell with dendrites stratifying solely in the sublamina b of the IPL. B2, Tracings of M2 cells to show dendritic morphology. C, Dendritic field diameter and total dendritic length of M1 (red; n = 16) and M2 (black; n = 13) cells. Mean dendritic field diameter and total dendritic length of M1 (green) and M2 (blue) cells are shown. D, Soma diameter of M1 (red: n = 16) and M2 (black: n = 13) cells. Mean soma diameter of M1 (red bar) and M2 (black bar) cells. E, F, M1 (green) and M2 (magenta) dendrites of neighboring M1 (yellow arrow) and M2 (white arrow) cells filled with Neurobiotin. ChAT, Choline acetyl transferase, IPL, inner plexiform layer. Scale bars: 50 μm.
Figure 2.
Figure 2.
Intrinsic light responses of M1 and M2 cells in whole-mount Opn4-EGFP mouse retinas. All light responses recorded in the presence of synaptic blockers and TTX. A, Left, EGFP signal under epifluorescent illumination of M1 (gray arrow) and M2 (white arrow) cell targeted for dual whole-cell current-clamp recordings. Right, Responses in current-clamp mode of M1 (gray trace) and M2 (black trace) cells shown in left panel to a 30 s white light stimulus. B, Left, EGFP signal under epifluorescent illumination of M1 (gray arrow) and M2 (white arrow) cell targeted for dual whole-cell voltage-clamp recordings. Right, Responses in voltage-clamp mode of M1 (gray trace) and M2 (black trace) cells shown in the left panel to a 30 s white light stimulus. C, Maximum depolarization evoked by single 30 s white light stimulus measured in current-clamp mode of M1 (gray; n = 17) and M2 (black; n = 19) cells. Mean depolarization of M1 (gray bar) and M2 (black bar) cells. D, Maximum current evoked by single 30 s white light stimulus measured in voltage-clamp mode of M1 (gray; n = 13) and M2 (black; n = 19) cells. Mean maximum current of M1 (gray bar) and M2 (black bar) cells. E, Brightness (in AUs) of epifluorescence of EGFP signal for pairs containing one M1 and one M2 cell. F, Irradiance response curves for M1 (gray; IR50 ∼ 3.25 × 10¹² photons · cm−2 · s−1) and M2 (black; IR50 ∼ 3.44 × 10¹³ photons · cm−2 · s−1) generated by stimulating cells with increasing intensities of a 5 s 480 nm light stimulus. G, Nucleated patch recordings were made in control solution from M2 cells (n = 5). H, I, Average of 5–7 light responses recorded from nucleated patches of two cells (cell 1, left panels; cell 2, right panels) in current-clamp mode to a fixed, bright 5 s (H) or 30 s (I) white light stimulus. J, Expanded view of first 1 s of 30 s light stimulation for cell 1 (left panel) and cell 2 (right panel). Scale bars: 50 μm. IR50, Irradiance yielding half-maximal response.
Figure 3.
Figure 3.
Responses of M1 and M2 cells to hyperpolarizing current pulses. Recordings were performed in the presence of synaptic blockers. A, B, Responses of M1 (A) and M2 (B) cells to 1 s hyperpolarizing current injection. Values to the right of the steps indicate the maximum current injection shown. C, RN and Vm of M1 (red; n = 23) and M2 (black; n = 25) cells. Mean RN and Vm shown for M1 (green bars) and M2 (blue bars) cells. D, Mean ± SE voltage response of M1 (red, n = 15) and M2 (black, n = 12) cells to hyperpolarizing current steps. Current injections were divided by capacitance of the cells to facilitate averaging (bin = 0.5 pA/pF). Points were fit with linear regression. RN, Input resistance; Vm, resting membrane potential.
Figure 4.
Figure 4.
Responses of M1 and M2 cells to depolarizing current pulses. Recordings were performed in the presence of synaptic blockers. A, B, Representative response of M1 (A) and M2 (B) cells to 1 s depolarizing current injection. Values to the right of the current steps indicate maximum current injection shown. C, Instantaneous frequency of the first interspike interval for M1 cell in A (gray) and M2 cell in B (black). D, Average firing rate for duration of 1 s depolarizing steps for M1 cell in A (gray) and M2 cell in B (black). E, Instantaneous frequency over time for M1 cell in A. F, Instantaneous frequency over time for M2 cell in B. G, Mean ± SE instantaneous frequency of the first interspike interval (circles) and mean ± SE firing rate (squares) during current injection for M1 (gray, n = 15) and M2 (black, n = 12) cells. Current injection for each cell was divided by its capacitance (bin = 0.5 pA/pF) to facilitate averaging.

References

    1. Baver SB, Pickard GE, Sollars PJ, Pickard GE. Two types of melanopsin retinal ganglion cell differentially innervate the hypothalamic suprachiasmatic nucleus and the olivary pretectal nucleus. Eur J Neurosci. 2008;27:1763–1770. - PubMed
    1. Berson DM, Dunn FA, Takao M. Phototransduction by retinal ganglion cells that set the circadian clock. Science. 2002;295:1070–1073. - PubMed
    1. Coombs J, van der List D, Wang GY, Chalupa LM. Morphological properties of mouse retinal ganglion cells. Neuroscience. 2006;140:123–136. - PubMed
    1. Dacey DM, Liao HW, Peterson BB, Robinson FR, Smith VC, Pokorny J, Yau KW, Gamlin PD. Melanopsin-expressing ganglion cells in primate retina signal colour and irradiance and project to the LGN. Nature. 2005;433:749–754. - PubMed
    1. Güler AD, Ecker JL, Lall GS, Haq S, Altimus CM, Liao HW, Barnard AR, Cahill H, Badea TC, Zhao H, Hankins MW, Berson DM, Lucas RJ, Yau KW, Hattar S. Melanopsin cells are the principal conduits for rod-cone input to non-image-forming vision. Nature. 2008;453:102–105. - PMC - PubMed

Publication types

MeSH terms

LinkOut - more resources