. 2009 May;50(5):894-907.
doi: 10.1194/jlr.M800622-JLR200. Epub 2009 Jan 14.

Selective delipidation of plasma HDL enhances reverse cholesterol transport in vivo

Affiliations

Selective delipidation of plasma HDL enhances reverse cholesterol transport in vivo

Frank M Sacks et al. J Lipid Res. 2009 May.

Abstract

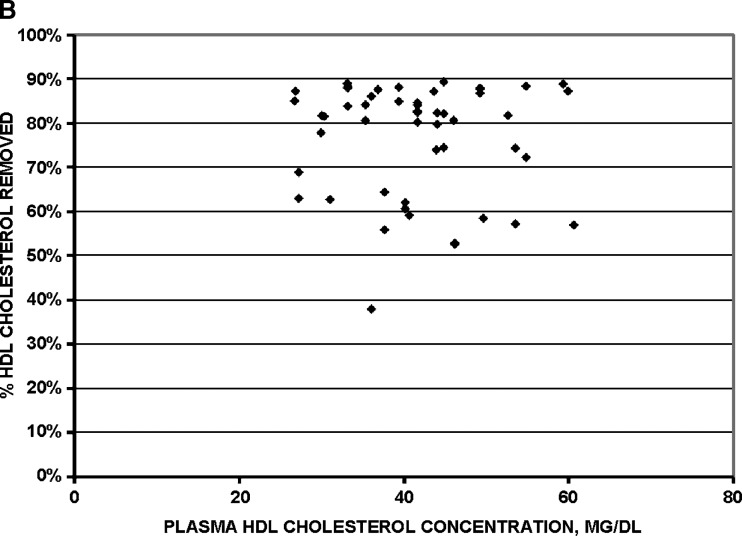
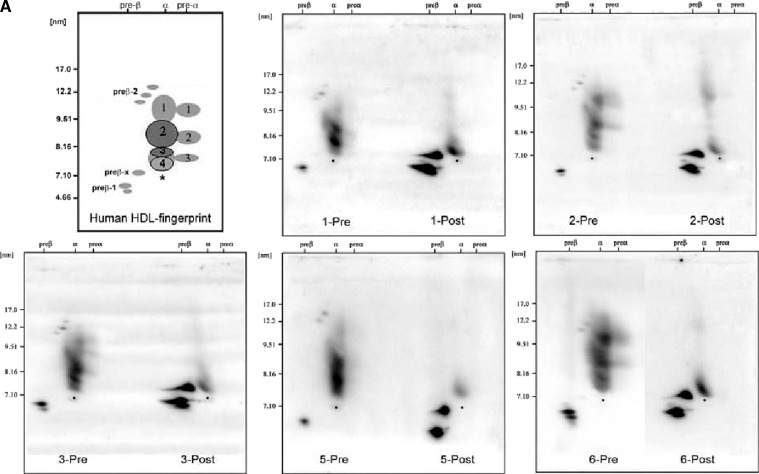
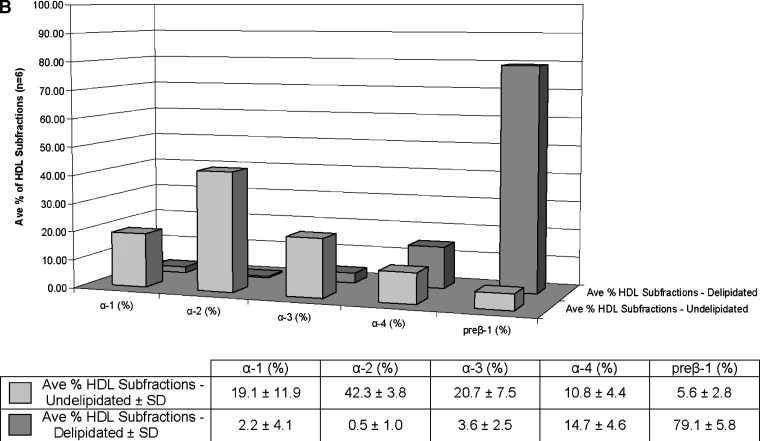
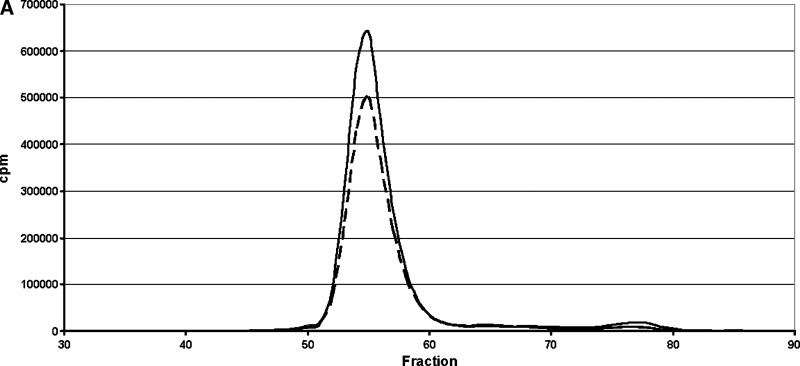
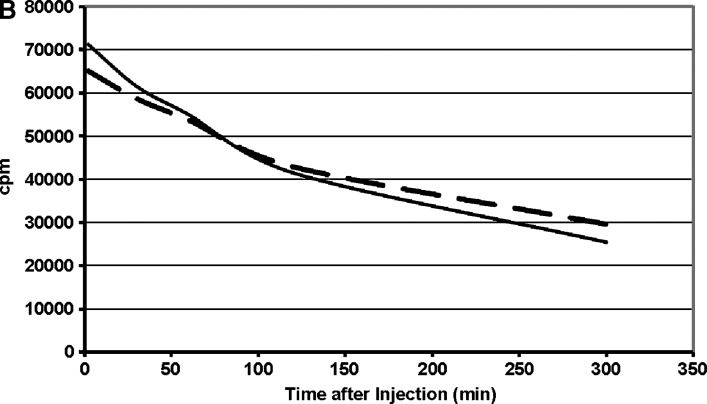
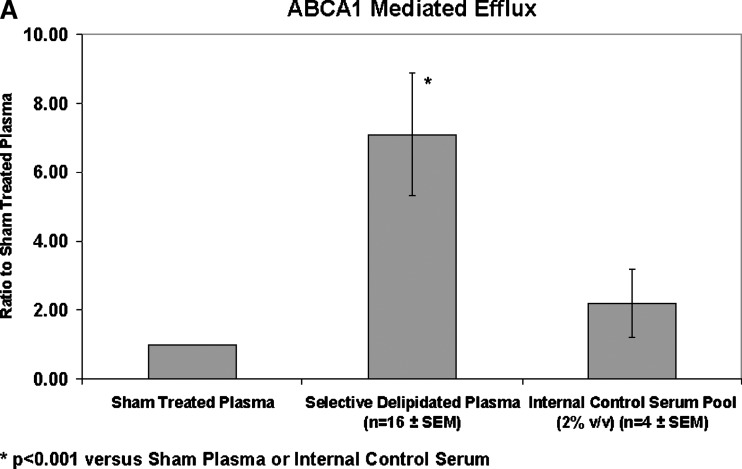
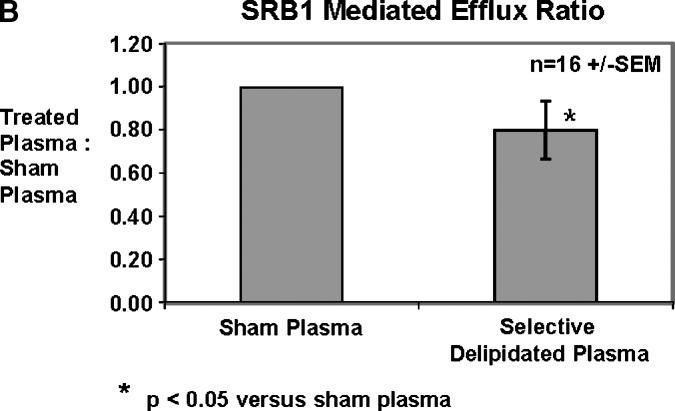
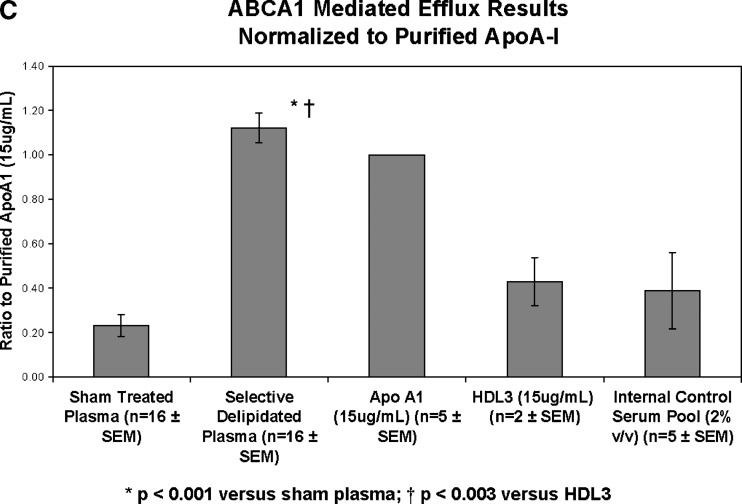
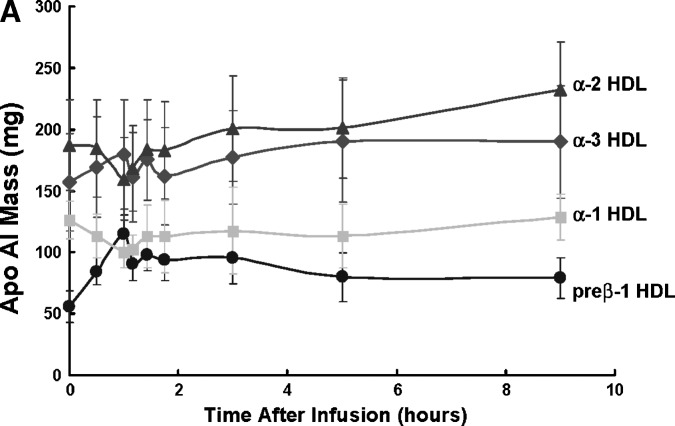
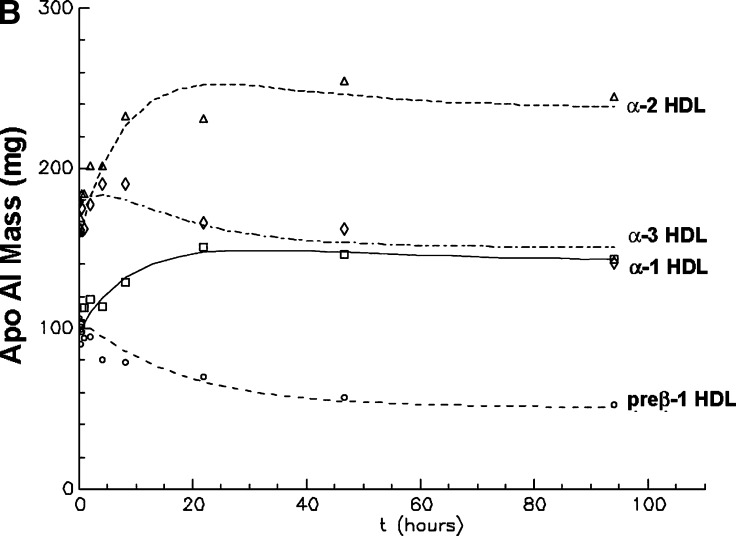
Uptake of cholesterol from peripheral cells by nascent small HDL circulating in plasma is necessary to prevent atherosclerosis. This process, termed reverse cholesterol transport, produces larger cholesterol-rich HDL that transfers its cholesterol to the liver facilitating excretion. Most HDL in plasma is cholesterol-rich. We demonstrate that treating plasma with a novel selective delipidation procedure converts large to small HDL [HDL-selectively delipidated (HDL-sdl)]. HDL-sdl contains several cholesterol-depleted species resembling small alpha, prebeta-1, and other prebeta forms. Selective delipidation markedly increases efficacy of plasma to stimulate ABCA1-mediated cholesterol transfer from monocytic cells to HDL. Plasma from African Green monkeys underwent selective HDL delipidation. The delipidated plasma was reinfused into five monkeys. Prebeta-1-like HDL had a plasma residence time of 8 +/- 6 h and was converted entirely to large alpha-HDL having residence times of 13-14 h. Small alpha-HDL was converted entirely to large alpha-HDL. These findings suggest that selective HDL delipidation activates reverse cholesterol transport, in vivo and in vitro. Treatment with delipidated plasma tended to reduce diet-induced aortic atherosclerosis in monkeys measured by intravascular ultrasound. These findings link the conversion of small to large HDL, in vivo, to improvement in atherosclerosis.


Figures

Fig. 1.
Fig. 1.
Design of HDL kinetics study in African Green Monkeys (vervets). Vervet plasma underwent selective HDL delipidation and was infused into five recipient vervets. Arrows depict times of blood sampling.
Fig. 2.
Fig. 2.
Compartmental model for metabolism of preβ-1 and α-HDL in African Green Monkeys. Compartment 1: plasma preβ-1 apoA-I. Compartment 11: noncirculating preβ-1 apoA-I. Compartment 2: plasma α-3 apoA-I. Compartment 21: Noncirculating α-3 apoA-I. Compartment 3: plasma α-2 apoA-I. Compartment 4: plasma α-1 apoA-I. Compartments 5 and 6: delay compartments. Selectively delipidated vervet plasma containing preβ-1-like, α-3, α-2, and α-1 HDL was infused into five recipient vervets. Noncirculating compartments 11 and 21 are required for preβ-1 and α-3 HDL because the amount of injected donor apoA-I in these two fractions was significantly higher than the increment in plasma preβ-1 and α-3 HDL observed in recipient monkeys (i.e., only a fraction of injected apoA-I appears in plasma immediately after infusion and the rest appears after a delay). The residence times for the noncirculating compartments of preβ-1 and α-3 HDL are the reciprocals of the rate constants k(1,11) and k(2,21), respectively. Data represented are mean ± SEM from modeling five monkeys individually. k, rate constants (pools/day); d, delay compartment; % = flux distributions.
Fig. 3.
Fig. 3.
Effect on lipoprotein size and composition of selective HDL delipidation. Size exclusion chromatography on Superose 6. Solid line: native plasma. Broken line: plasma after selective HDL delipidation. N = 5 normal plasma pools.
Fig. 4.
Fig. 4.
Efficacy of selective HDL delipidation in 51 human plasma samples. A: mass of cholesterol removed from HDL is proportional to the plasma HDL cholesterol concentration. B: percent of cholesterol removed from HDL is constant across the range of HDL cholesterol concentrations.
Fig. 4.
Fig. 4.
Efficacy of selective HDL delipidation in 51 human plasma samples. A: mass of cholesterol removed from HDL is proportional to the plasma HDL cholesterol concentration. B: percent of cholesterol removed from HDL is constant across the range of HDL cholesterol concentrations.
Fig. 5.
Fig. 5.
Selective HDL delipidation of human plasma produces a large shift in HDL types from α to preβ HDL, demonstrated by native two-dimensional gel electrophoresis. A: The upper left panel “Human HDL-fingerprint” represents the apoA-I containing (light gray) and apoA-I:A-II containing (dark gray) HDL subpopulations in normolipidemic healthy human subjects in previous studies (16, 19). The asterisk represents the position of human serum albumin, which marks the α-front. The larger α- and preα-mobility HDL (i.e., α-1, α-2, are lipid-rich spherical particles); the smaller α-3, α-4 HDL are lipid-poor discs or transitional particles. Preβ-2 consists of large, but lipid-poor discoidal particles; preβ-1 consists of small, lipid-poor discs. Preβ-x represents the in-vitro shedding of lipid-poor apoA-I from larger HDL particles caused by the selective delipidation procedure. Lipid content and shape of these bands were determined in previous studies (16, 19). The remaining five panels show HDL in undelipidated plasma (left) and in selectively delipidated plasma from five normal human samples. “Pre” is undelipidated plasma, and “Post” is that of the same plasma selectively delipidated. Samples were subjected to nondenaturing two-dimensional gel electrophoresis and were immunolocalized with human apoA-I antibody. B: percentage of HDL apoA-I in preβ and α HDL in six normal subjects, five of whom are shown in the electrophoretograms in the upper panel. Mean ± SD. Front bars show undelipidated plasma, rear bars show the same plasma sample after selective delipidation. Data determined by scanning the gels shown in the upper panel, and applying the percentages to plasma total apoA-I. The minor preα 1, 2, and 3, 1–4% of total apoA-I is included with the respective α-HDL in predelipidated samples and was not found postdelipidation. Preβ-2, present only in predelipidated samples, 1% of total apoA-I, is not included. Preβ-x is included with the preβ-1. The mean total apoA-I concentration of the samples before delipidation was 112 mg/dl, and 91% was recovered after the procedure.
Fig. 5.
Fig. 5.
Selective HDL delipidation of human plasma produces a large shift in HDL types from α to preβ HDL, demonstrated by native two-dimensional gel electrophoresis. A: The upper left panel “Human HDL-fingerprint” represents the apoA-I containing (light gray) and apoA-I:A-II containing (dark gray) HDL subpopulations in normolipidemic healthy human subjects in previous studies (16, 19). The asterisk represents the position of human serum albumin, which marks the α-front. The larger α- and preα-mobility HDL (i.e., α-1, α-2, are lipid-rich spherical particles); the smaller α-3, α-4 HDL are lipid-poor discs or transitional particles. Preβ-2 consists of large, but lipid-poor discoidal particles; preβ-1 consists of small, lipid-poor discs. Preβ-x represents the in-vitro shedding of lipid-poor apoA-I from larger HDL particles caused by the selective delipidation procedure. Lipid content and shape of these bands were determined in previous studies (16, 19). The remaining five panels show HDL in undelipidated plasma (left) and in selectively delipidated plasma from five normal human samples. “Pre” is undelipidated plasma, and “Post” is that of the same plasma selectively delipidated. Samples were subjected to nondenaturing two-dimensional gel electrophoresis and were immunolocalized with human apoA-I antibody. B: percentage of HDL apoA-I in preβ and α HDL in six normal subjects, five of whom are shown in the electrophoretograms in the upper panel. Mean ± SD. Front bars show undelipidated plasma, rear bars show the same plasma sample after selective delipidation. Data determined by scanning the gels shown in the upper panel, and applying the percentages to plasma total apoA-I. The minor preα 1, 2, and 3, 1–4% of total apoA-I is included with the respective α-HDL in predelipidated samples and was not found postdelipidation. Preβ-2, present only in predelipidated samples, 1% of total apoA-I, is not included. Preβ-x is included with the preβ-1. The mean total apoA-I concentration of the samples before delipidation was 112 mg/dl, and 91% was recovered after the procedure.
Fig. 6.
Fig. 6.
Metabolism in mice of human LDL from selectively delipidated plasma. A: LDL elution profile by size exclusion chromatography on Biogel A 15m. B: disappearance of radioactivity from LDL after injection into mice. Mean of five mice. Solid lines: 131I-LDL in native human plasma. Broken lines: 125I-LDL in plasma treated with the selective HDL delipidation method. Disappearance curves for radioactivity were fit by GraphPad Prism and half-lives computed. The mean (SD) for T1/2 for 131I-LDL was 3.1 ± 0.2 h and for 125I-LDL was 4.1 ± 0.4 h (P < 0.01).
Fig. 6.
Fig. 6.
Metabolism in mice of human LDL from selectively delipidated plasma. A: LDL elution profile by size exclusion chromatography on Biogel A 15m. B: disappearance of radioactivity from LDL after injection into mice. Mean of five mice. Solid lines: 131I-LDL in native human plasma. Broken lines: 125I-LDL in plasma treated with the selective HDL delipidation method. Disappearance curves for radioactivity were fit by GraphPad Prism and half-lives computed. The mean (SD) for T1/2 for 131I-LDL was 3.1 ± 0.2 h and for 125I-LDL was 4.1 ± 0.4 h (P < 0.01).
Fig. 7.
Fig. 7.
Cell cholesterol efflux caused by selectively delipidated plasma. A: ABCA1 mediated efflux. Ratio of selectively delipidated or native plasma to sham delipidated plasma. Compared with sham processed plasma (no delipidation reagents), selectively delipidated plasma increased ABCA1 specific cholesterol efflux by 7.1 ± 1.8 (SEM) fold. The median increase was four-fold, and the range was 1.3 to 27. Control serum is an internal standard and is added at 2% v/v, and results are typical. B: SRB1 mediated efflux. Ratio of selectively delipidated to sham delipidated plasma. C: ABCA1 mediated efflux. Effects of selectively delipidated plasma, native plasma (sham delipidated control), apoA-I, and HDL-3. Vertical axis units are efflux ratio of samples to purified human apoA-I. N = 16 plasma samples, mean ± SEM.
Fig. 7.
Fig. 7.
Cell cholesterol efflux caused by selectively delipidated plasma. A: ABCA1 mediated efflux. Ratio of selectively delipidated or native plasma to sham delipidated plasma. Compared with sham processed plasma (no delipidation reagents), selectively delipidated plasma increased ABCA1 specific cholesterol efflux by 7.1 ± 1.8 (SEM) fold. The median increase was four-fold, and the range was 1.3 to 27. Control serum is an internal standard and is added at 2% v/v, and results are typical. B: SRB1 mediated efflux. Ratio of selectively delipidated to sham delipidated plasma. C: ABCA1 mediated efflux. Effects of selectively delipidated plasma, native plasma (sham delipidated control), apoA-I, and HDL-3. Vertical axis units are efflux ratio of samples to purified human apoA-I. N = 16 plasma samples, mean ± SEM.
Fig. 8.
Fig. 8.
A: Preβ-1 and α HDL apoA-I plasma mass (pool size) in vervets at baseline and immediately after infusion of selectively delipidated vervet plasma (mean ± SEM of five vervets) B: Modeling fitting of preβ-1 and α-HDL apoA-I mass after infusion. Symbols are the masses of apoAI in each HDL type. Lines are fitted curves to the data determined by kinetic modeling using the model in Fig. 2. Mean of five vervets. “Preβ-1” includes preβ-x as shown in Fig. 5.
Fig. 8.
Fig. 8.
A: Preβ-1 and α HDL apoA-I plasma mass (pool size) in vervets at baseline and immediately after infusion of selectively delipidated vervet plasma (mean ± SEM of five vervets) B: Modeling fitting of preβ-1 and α-HDL apoA-I mass after infusion. Symbols are the masses of apoAI in each HDL type. Lines are fitted curves to the data determined by kinetic modeling using the model in Fig. 2. Mean of five vervets. “Preβ-1” includes preβ-x as shown in Fig. 5.

References

    1. Barr D. P., E. M. Russ, and H. A. Eder. 1951. Protein-lipid relationships in human plasma. II. In atherosclerosis and related conditions. Am. J. Med. 11 480–493. - PubMed
    1. Gofman J. W., W. Young, and R. Tandy. 1966. Ischemic heart disease, Atherosclerosis, and longevity. Circulation. 34 679–697. - PubMed
    1. Miller G. J., and N. E. Miller. 1975. Plasma-high-density-lipoprotein concentration and development of ischaemic heart-disease. Lancet. 1 16–19. - PubMed
    1. Gordon D. J., J. L. Probstfield, R. J. Garrison, J. D. Neaton, W. P. Castelli, J. D. Knoke, D. R. Jacobs, S. Bangdiwala, and H. A. Tyroler. 1989. High-density lipoprotein cholesterol and cardiovascular disease: four prospective American studies. Circulation. 79 8–15. - PubMed
    1. Sanossian N., J. L. Saver, M. Navab, and B. Ovbiagele. 2007. High density lipoprotein cholesterol. An emerging target for stroke treatment. Stroke. 38 1104–1109. - PubMed

Publication types