. 2009 Mar;75(6):626-33.
doi: 10.1038/ki.2008.659. Epub 2009 Jan 14.

Inactivation of Pkd1 in principal cells causes a more severe cystic kidney disease than in intercalated cells

Affiliations

Inactivation of Pkd1 in principal cells causes a more severe cystic kidney disease than in intercalated cells

Kalani L Raphael et al. Kidney Int. 2009 Mar.

Abstract

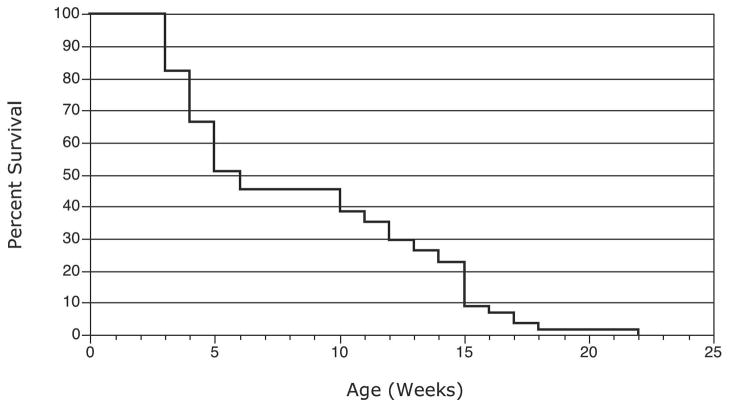
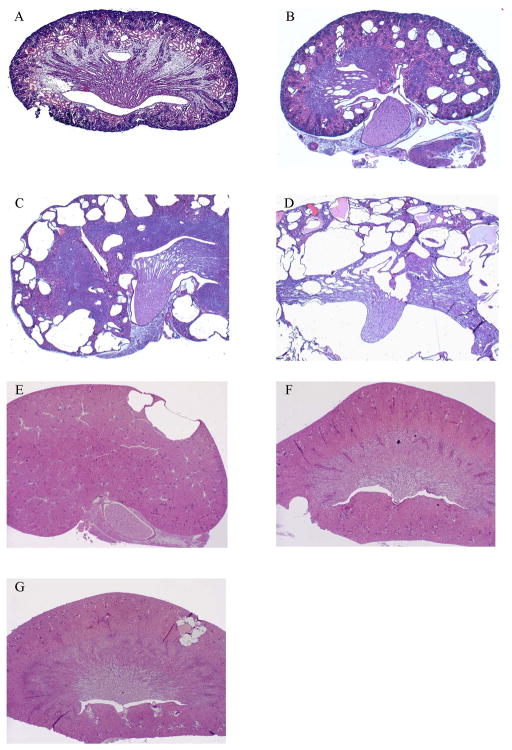
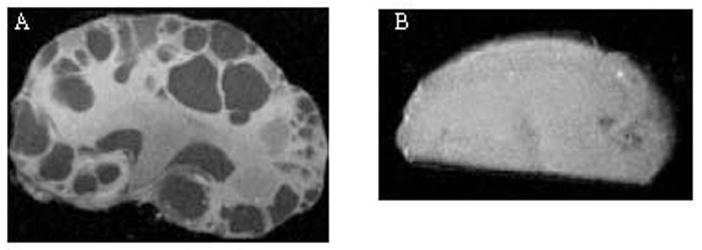
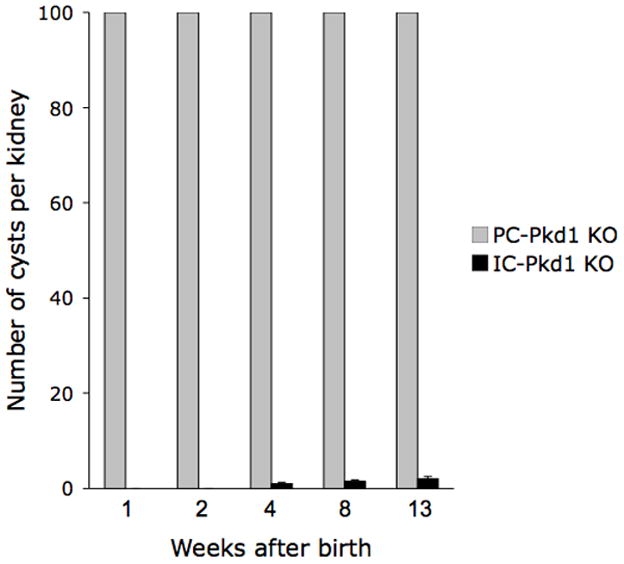
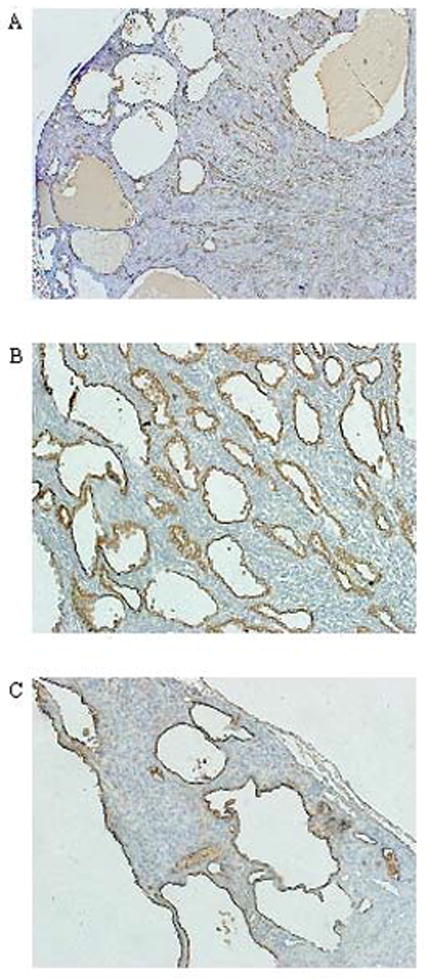
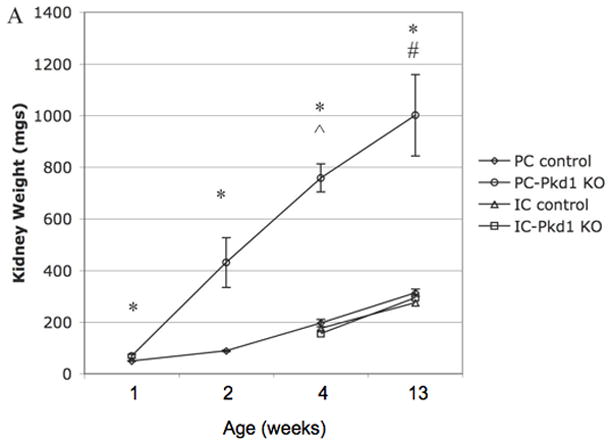
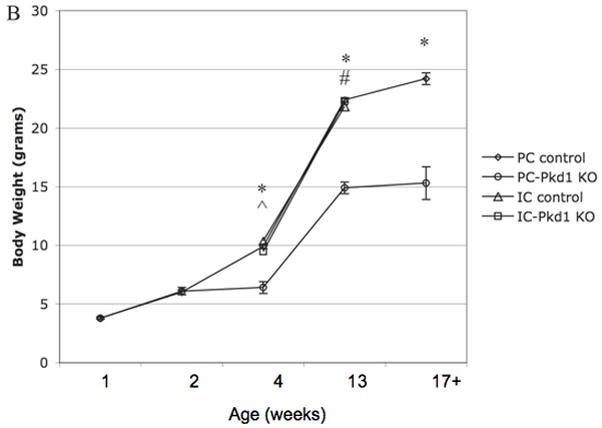
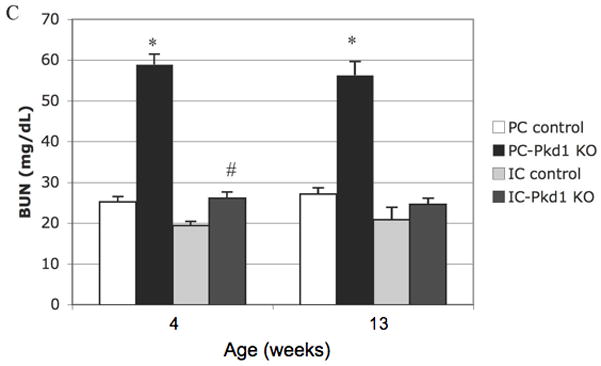
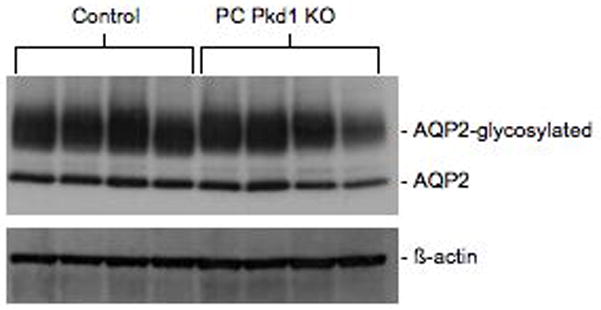
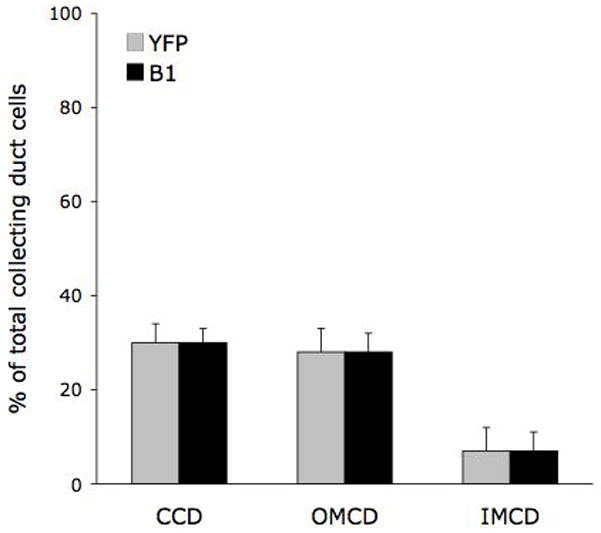
Renal cysts in autosomal dominant polycystic kidney disease arise from cells throughout the nephron, but there is an uncertainty as to whether both the intercalated cells (ICs) and principal cells (PCs) within the collecting duct give rise to cysts. To determine this, we crossed mice containing loxP sites within introns 1 and 4 of the Pkd1 gene with transgenic mice expressing Cre recombinase under control of the aquaporin-2 promoter or the B1 subunit of the proton ATPase promoter, thereby generating PC- or IC-specific knockout of Pkd1, respectively. Mice, that had Pkd1 deleted in the PCs, developed progressive cystic kidney disease evident during the first postnatal week and had an average lifespan of 8.2 weeks. There was no change in the cellular cAMP content or membrane aquaporin-2 expression in their kidneys. Cysts were present in the cortex and outer medulla but were absent in the papilla. Mice in which PKd1 was knocked out in the ICs had a very mild cystic phenotype as late as 13 weeks of age, limited to 1-2 cysts and confined to the outer rim of the kidney cortex. These mice lived to at least 1.5 years of age without evidence of early mortality. Our findings suggest that PCs are more important than ICs for cyst formation in polycystic kidney disease.


Figures

Figure 1
Figure 1
The mean survival of 57 PC-Pkd1 KO mice was 8.2 weeks (range 2.1–21.6, SE +/− 0.7).
Figure 2
Figure 2
Representative sections of PC-Pkd1 KO mice (A–D) and IC-Pkd1 KO mice (E–G) stained with hematoxylin and eosin. A) PC-Pkd1 KO at birth, 4x. B) PC-Pkd1 KO at 1 week, 2x. C) PC-Pkd1 KO at 2 weeks, 2x. D) PC-Pkd1 KO at 4 weeks, 2x. E) IC-Pkd1 KO at 4 weeks. F) IC-Pkd1 KO at 8 weeks. G) IC-Pkd1 KO at 13 weeks.
Figure 3
Figure 3
Representative MRIs of kidneys obtained from (A) PC-Pkd1 KO and (B) IC-Pkd1 KO. The MRIs are from PC-Pkd1 KO mice at 2 weeks of age and IC-Pkd1 KO mice at 13 weeks of age.
Figure 4
Figure 4
Number of cysts at varying ages in PC-Pkd1 KO and IC-Pkd1 KO mice. PC-Pkd1 KO bars are at maximal height - these kidneys had greater than 100 cysts. N=10 kidneys each data point.
Figure 5
Figure 5
Representative sections of PC-Pkd1 KO (A–B) and IC-Pkd1 KO mice (C) stained with DBA (brown) showing collecting duct origin of cysts. A) PC-Pkd1 KO at week 4, 2x. B) PC-Pkd1 KO at week 4, 20x. C) IC-Pkd1 KO at week 13, 20x.
Figure 6
Figure 6
(A) Kidney weight of PC-Pkd1 KO and IC-Pkd1 KO expressed as mean and standard error. * p < 0.0001 for the comparison of PC-Pkd1 KO and PC controls at weeks 1, 2, 4 and 8. ^ p = 0.0001 at 4 weeks and # p = 0.0026 at 8 weeks for the comparison of PC-Pkd1 KO and IC-Pkd1 KO. Kidney weight between IC-Pkd1 KO and IC controls was NS different. (B) Body weight of PC-Pkd1 KO and IC-Pkd1 KO expressed as mean and standard error. * p < 0.0001 for the comparison of PC-Pkd1 KO and PC controls at 4, 8 and 13 weeks. Body weight was NS different at D7 and D14. ^ p = 0.024 at 4 weeks and # p = 0.0026 at 8 weeks for the comparison of PC-Pkd1 KO and IC-Pkd1 KO. Body weight between IC-Pkd1 KO and IC controls was NS different. (C) BUN of PC-Pkd1 KO and IC-Pkd1 KO expressed as mean and standard error. * p < 0.0001 for the comparisons of PC-Pkd1 KO versus PC controls and PC-Pkd1 KO versus IC-Pkd1 KO at 4 and 13 weeks. # p = 0.0054 for the comparison of IC-Pkd1 KO and IC controls at 4 weeks. The difference between IC-Pkd1 KO and IC controls at 13 weeks was NS.
Figure 6
Figure 6
(A) Kidney weight of PC-Pkd1 KO and IC-Pkd1 KO expressed as mean and standard error. * p < 0.0001 for the comparison of PC-Pkd1 KO and PC controls at weeks 1, 2, 4 and 8. ^ p = 0.0001 at 4 weeks and # p = 0.0026 at 8 weeks for the comparison of PC-Pkd1 KO and IC-Pkd1 KO. Kidney weight between IC-Pkd1 KO and IC controls was NS different. (B) Body weight of PC-Pkd1 KO and IC-Pkd1 KO expressed as mean and standard error. * p < 0.0001 for the comparison of PC-Pkd1 KO and PC controls at 4, 8 and 13 weeks. Body weight was NS different at D7 and D14. ^ p = 0.024 at 4 weeks and # p = 0.0026 at 8 weeks for the comparison of PC-Pkd1 KO and IC-Pkd1 KO. Body weight between IC-Pkd1 KO and IC controls was NS different. (C) BUN of PC-Pkd1 KO and IC-Pkd1 KO expressed as mean and standard error. * p < 0.0001 for the comparisons of PC-Pkd1 KO versus PC controls and PC-Pkd1 KO versus IC-Pkd1 KO at 4 and 13 weeks. # p = 0.0054 for the comparison of IC-Pkd1 KO and IC controls at 4 weeks. The difference between IC-Pkd1 KO and IC controls at 13 weeks was NS.
Figure 7
Figure 7
Western blot of glycosylated and unglycosylated AQP2 levels in 4-week old PC-Pkd1 KO and control mice. Data are shown from 4 separate mice in each group.
Figure 8
Figure 8
Number of intercalated cells in mouse collecting duct. Sections of control mouse kidneys were immunostained for the V-ATPase B1subunit (B1), and the percent of B1 positive cells (compared to total collecting duct cells) in a given region of kidney determined. The percent of intercalated cells within the collecting duct was also assessed by breeding B1-Cre mice with reporter mice transgenic for ROSA26 -YFP; YFP-positive intercalated cells were yellow. Each data point represents counting of 10 sections per kidney in 5 kidneys. CCD - cortical collecting duct; OMCD - outer medullary collecting duct; IMCD - inner medullary collecting duct.

Similar articles

Cited by

References

    1. Huseman R, Grady A, Welling D, et al. Macropuncture study of polycystic disease in adult human kidneys. Kidney Int. 1980;18:375–385. - PubMed
    1. Bachinsky DR, Sabolic I, Emmanouel DS, et al. Water channel expression in human ADPKD kidneys. Am J Physiol. 1995;268:F398–F403. - PubMed
    1. Hayashi M, Yamaji Y, Monkawa T, et al. Expression and localization of the water channels in human autosomal dominant polycystic kidney disease. Nephron. 1997;75:321–326. - PubMed
    1. Kovacs J, Zilahy M, Gomba S. Morphology of cystic renal lesions. Lectin and immuno-histochemical study. Acta Chir Hung. 1997;36:176–178. - PubMed
    1. Yoder BK, Mulroy S, Eustace H, et al. Molecular pathogenesis of autosomal dominant polycystic kidney disease. Expert Rev Mol Med. 2006;8:1–22. - PubMed

Publication types

Substances