. 2009;4(1):e4201.
doi: 10.1371/journal.pone.0004201. Epub 2009 Jan 15.

Abeta42-induced neurodegeneration via an age-dependent autophagic-lysosomal injury in Drosophila

Affiliations

Abeta42-induced neurodegeneration via an age-dependent autophagic-lysosomal injury in Drosophila

Daijun Ling et al. PLoS One. 2009.

Abstract

The mechanism of widespread neuronal death occurring in Alzheimer's disease (AD) remains enigmatic even after extensive investigation during the last two decades. Amyloid beta 42 peptide (Abeta(1-42)) is believed to play a causative role in the development of AD. Here we expressed human Abeta(1-42) and amyloid beta 40 (Abeta(1-40)) in Drosophila neurons. Abeta(1-42) but not Abeta(1-40) causes an extensive accumulation of autophagic vesicles that become increasingly dysfunctional with age. Abeta(1-42)-induced impairment of the degradative function, as well as the structural integrity, of post-lysosomal autophagic vesicles triggers a neurodegenerative cascade that can be enhanced by autophagy activation or partially rescued by autophagy inhibition. Compromise and leakage from post-lysosomal vesicles result in cytosolic acidification, additional damage to membranes and organelles, and erosive destruction of cytoplasm leading to eventual neuron death. Neuronal autophagy initially appears to play a pro-survival role that changes in an age-dependent way to a pro-death role in the context of Abeta(1-42) expression. Our in vivo observations provide a mechanistic understanding for the differential neurotoxicity of Abeta(1-42) and Abeta(1-40), and reveal an Abeta(1-42)-induced death execution pathway mediated by an age-dependent autophagic-lysosomal injury.


Conflict of interest statement

Competing Interests: The authors have declared that no competing interests exist.

Figures

Figure 1
Figure 1. Aβ1–40 and Aβ1–42 have differential neurotoxicity.
(A–B) Aβ1–42 but not Aβ1–40 expression decreases fly lifespan (A) and climbing ability (B) (lifespan assay, N = 953, 633 and 965 for three parallel cohorts of control, Aβ1–40 and Aβ1–42 flies respectively; data are the mean±SEM; climbing assay, N = 160 for all three cohorts). Note that survival rates correlate well with climbing ability in control and Aβ1–40 flies. However, 88% of Aβ1–42 flies at 16 days survive with only 5% maintaining active climbing ability. Aβ1–42 flies thus have accelerated neurological deficits that precede animal death. (C) Levels of Aβ transcripts in fly heads are significantly higher for Aβ1–40 relative to Aβ1–42 (data are the mean+SEM, N = 3 for each group, two-tailed P value by student's t test). (D–E) Cytosolic GFP fluorescence exhibits an even distribution in Aβ1–40 flies (16-day-old adult, D) in contrast to an extensive accumulation of punctate structures in an age- and region-matched Aβ1–42 sample (E). GFP fluorescence in the Aβ1–42 sample is decreased in cytosol (arrowheads) but especially bright in puncta (arrows). Some neuronal somas appear abnormally large (stars). Cellular boundaries also appear to be indistinct (arrowheads). Note that cytosolic GFP expression is independent of the expression of Aβ1–40 or Aβ1–42 thus the fluorescent puncta are not likely to be the structure of Aβ1–42 aggregation. (F) An age-dependent increase of fluorescent puncta in Aβ1–42-targeted neurons (data are mean+SEM, two-tailed P values by student's t test, n = 9 for each group). Scale bars = 5 µm.
Figure 2
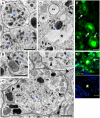
Figure 2. Aβ1–42 induces an accumulation of large autophagic vesicles.
(A) Electron micrograph of typical neuronal somas from a control fly shows the nucleus (N, outlined in blue) surrounded by a limited amount of cytoplasm and no evidence of autophagic vesicles. (B) Electron micrograph of neuronal soma from an Aβ1–42 fly exhibits an abnormally large volume of cytoplasm occupied by an extensive accumulation of large autophagic vesicles (arrowheads). The double arrowheads point to autophagic vesicles derived from the fusion of several smaller vesicles. (C) Cytosolic RFP expression shows Aβ1–42-induced puncta (top panel, arrows) colocalized with punctate Atg8a-GFP (middle panel, arrows), suggesting that they are autophagic vesicles. Scale bars = 1 µm (A–B) or 5 µm (C).
Figure 3
Figure 3. Aβ1 –42 induces an age-dependent dysfunction in autophagic degradation.
(A) Control flies fed with 1 µM rapamycin up to 16 days exhibit no accumulation of fluorescent puncta in neurons, suggesting that induction of normal autophagy in healthy neurons is not sufficient to induce formation of fluorescent puncta. (B–C) Neurons from 1-day-old Aβ1–42 flies exhibit numerous autophagic vesicles (arrows) in electron micrographs (B) but no fluorescent puncta in confocal micrographs (C), suggesting that autophagic vesicles at an early age can efficiently digest GFP. (D) Confocal micrograph of neurons from 16-day-old Aβ1–42 flies exhibit an extensive accumulation of fluorescent puncta (arrows). (E) Fluorescent puncta (left panel, arrows) colocalize with Aβ1–42 immunostaining (middle panel, arrows) suggesting an association between the two. Scale bars = 5 µm (A, C–E) or 1 µm (B).
Figure 4
Figure 4. Dysfunctional autophagic vesicles are at a post-lysosomal fusion stage.
(A) Many GFP puncta in Aβ1–42-targeted neurons are stained by acidophilic LysoTracker Red (left panel, white arrows) while some are not (blue arrows). A high magnification view of an affected neuron (square area) shows a nearly complete colocalization of GFP puncta with LysoTracker Red staining (right two panels) suggesting that many GFP puncta are post-lysosomal vesicles. (B) Cytosolic YFP expression shows Aβ1–42-induced puncta (left panel, arrows) that colocalize with punctate LAMP1-GFP (middle panel, arrows), suggesting that they are post-lysosomal vesicles. Scale bars = 5 µm.
Figure 5
Figure 5. Autophagy-associated intraneuronal damage.
(A) Normal neurons from control fly brains show continuity in plasma and nuclear membrane and are homogeneous in perinuclear spaces; no large autophagic vesicles in cytoplasm are observed. (B–C) Large autophagic vesicles (arrowheads) in neurons from Aβ1–42 fly brains are associated with extensive subcellular damage to plasma (arrow in B) and nuclear membranes (arrows in C). (D) Degenerative neurons in Aβ1–42 flies exhibit electron lucent areas (stars) occupying a large part of the cytosol. These areas are irregular and not bounded by any limiting membrane distinguishing them from membrane-limited autophagy vacuoles (Av), suggesting that the electron lucent areas may represent uncontrolled digestion or erosive destruction of cytoplasmic components. The nucleus (N) of this neuron is also partially destroyed. (E–F) Confocal micrographs of affected neurons also show large cytosolic areas with weak or absent GFP fluorescence (arrows). DAPI staining is absent (star in F). The large irregular erosive areas (arrows in E–F) lack a well-defined edge, suggesting that they are not membrane-limited compartments devoid of GFP but cytoplasmic areas with unlimited digestion or erosive destruction. Scale bars = 1 µm (A–D) or 5 µm (E–F).
Figure 6
Figure 6. Aβ1–42-induced erosive destruction of cytoplasm results from a compromise and leakage of autophagic vesicles.
(A) Local electron lucent area in cytosol (arrow) surrounds autophagic vesicles (arrowheads), suggesting an association between them. (B–C) Multilamellar structures, usually well-packed in autophagic vesicles (arrowhead in B), are unexpectedly seen in cytosol (black arrows in C) where they loosely surround autophagic vesicles (arrowheads in C), suggesting a compromise of the vesicle membrane and a leakage of autophagic contents into cytosol. The red arrow in panel C points to an area in plasma with a discontinuous membrane bilayer. (D) Erosive areas with decreased or no GFP fluorescence (left panel, arrows) exhibit diffuse LysoTracker staining in enlarged regions of surrounding cytosol and numerous LysoTracker-positive puncta (middle panel, arrows), confirming that cytoplasmic acidification and erosive destruction may result from a leakage of compromised post-lysosomal autophagic vesicles. The three orthogonal planes demonstrate that the cytosolic LysoTracker staining is contained within this affected neuron. Scale bars = 1 µm (A–C) or 5 µm (D).
Figure 7
Figure 7. Widespread loss of neuronal integrity occurs in Aβ1–42-targeted neurons following extensive autophagic injury.
(A) Neurons from young control flies (middle age or earlier) without Aβ expression show homogenous GFP distribution and clear cell boundaries of neuronal somas, no apparent puncta formation. (B) Aβ1–40 expression causes no detectible abnormal autophagy in neurons from young flies (16-day adult, left panel). A few neurons in middle age (31 days) begin to exhibit abnormal autophagy (middle panel, arrows). But no age-dependent deterioration is observed up to 45 days (right panel). (C) Neurons expressing Aβ1–42 exhibit a relatively normal morphology in 1-day adults. Aβ1–42-targeted neurons in over 6-day adults exhibit progressive puncta accumulation, decreased cytosolic GFP fluorescence and loss of clear cell boundaries in affected neurons (arrows) due to an age-dependent autophagic injury. Scale bars = 5 µm.
Figure 8
Figure 8. Autophagy activity affects Aβ1–42 neurotoxicity.
(A) Drosophila incorporating a heterozygous loss-of-function allele Atg1Δ3D (Atg1+/−) exhibit a significant decrease in expression levels of Atg1 mRNA in fly brains (data are normalized mean+SEM relative to GAPDH, two-tailed P values by Student's t-test, n = 3 for each group). (B) Control flies with Atg1+/− genotype have a shortened mean lifespan compared to Atg1+/+ genotype (−13.6%, log-rank P<0.0001). In contrast, Aβ1–42 flies with Atg1+/− genotype have extended lifespan relative to Atg1+/+ genotype (+10.9%, log-rank P<0.0001) (data are the mean±SEM). (C) Normalized expression levels of Aβ1–42 transcripts exhibit no significant difference in Aβ1–42 fly heads between Atg1+/+ and Atg1+/− genotypes (data are the mean+SEM, N = 3 for each group, two-tailed P value by student's t test). (D) Aβ1–42 flies with Atg1+/− genotype have significantly fewer fluorescent puncta in targeted neurons relative to Atg1+/+ genotype (fly age is 11 days, data are the mean+SEM, two-tailed P value by Student's t-test, n = 9 for each group). (E) Autophagy activation by rapamycin feeding (1 µM) results in a shorter lifespan for Aβ1–42 flies (−26.0%, log-rank P<0.0001), but has no obvious effect on the lifespan of Aβ1–40 flies (−1.5%, log-rank P = 0.076) relative to flies fed with the same amount of DMSO (data are the mean±SEM). N is the sample size of fly cohorts for each experimental condition.

Similar articles

Cited by

References

    1. Lansbury PT, Lashuel HA. A century-old debate on protein aggregation and neurodegeneration enters the clinic. Nature. 2006;443:774–779. - PubMed
    1. Hardy J, Selkoe DJ. The amyloid hypothesis of Alzheimer's disease: progress and problems on the road to therapeutics. Science. 2002;297:353–356. - PubMed
    1. Suzuki N, Cheung TT, Cai XD, Odaka A, Otvos L, Jr, et al. An increased percentage of long amyloid beta protein secreted by familial amyloid beta protein precursor (beta APP717) mutants. Science. 1994;264:1336–1340. - PubMed
    1. Laferla FM, Green KN, Oddo S. Intracellular amyloid-beta in Alzheimer's disease. Nat Rev Neurosci. 2007;8:499–509. - PubMed
    1. Gouras GK, Almeida CG, Takahashi RH. Intraneuronal Abeta accumulation and origin of plaques in Alzheimer's disease. Neurobiol Aging. 2005;26:1235–1244. - PubMed

Publication types