. 2008 Oct;12(5B):2145-54.
doi: 10.1111/j.1582-4934.2008.00459.x.

A coordinated approach to cutaneous wound healing: vibrational microscopy and molecular biology

Affiliations

A coordinated approach to cutaneous wound healing: vibrational microscopy and molecular biology

K L Andrew Chan et al. J Cell Mol Med. 2008 Oct.

Abstract

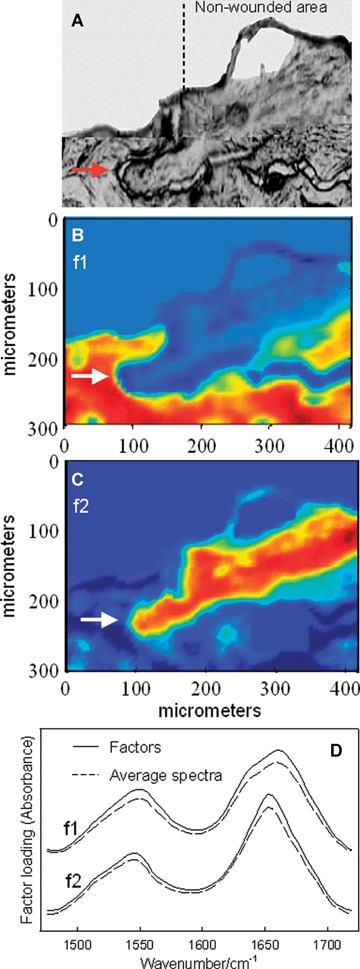
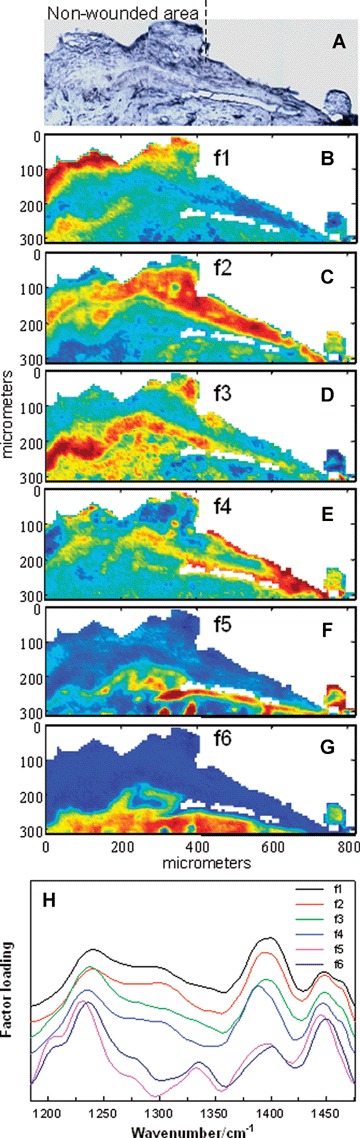
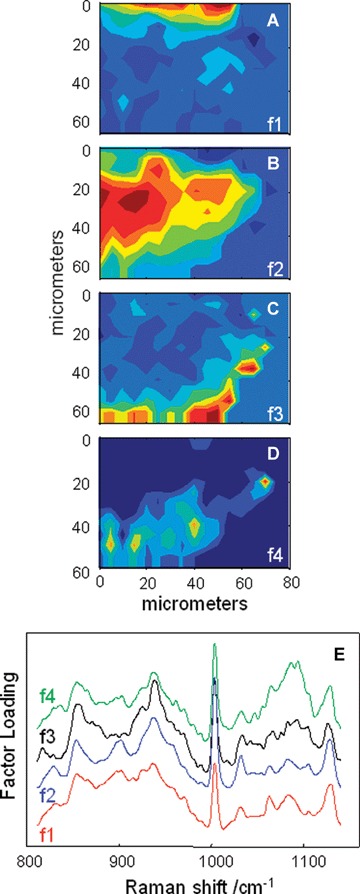
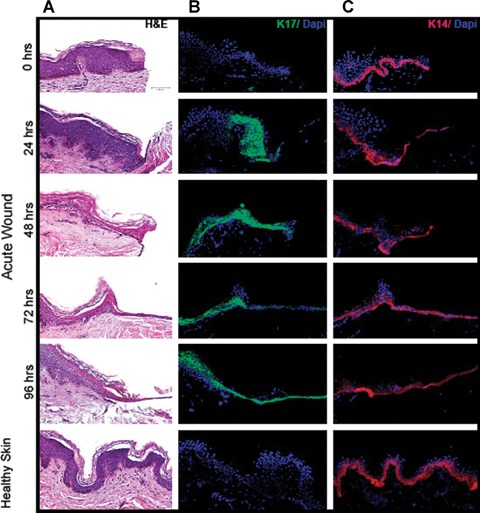
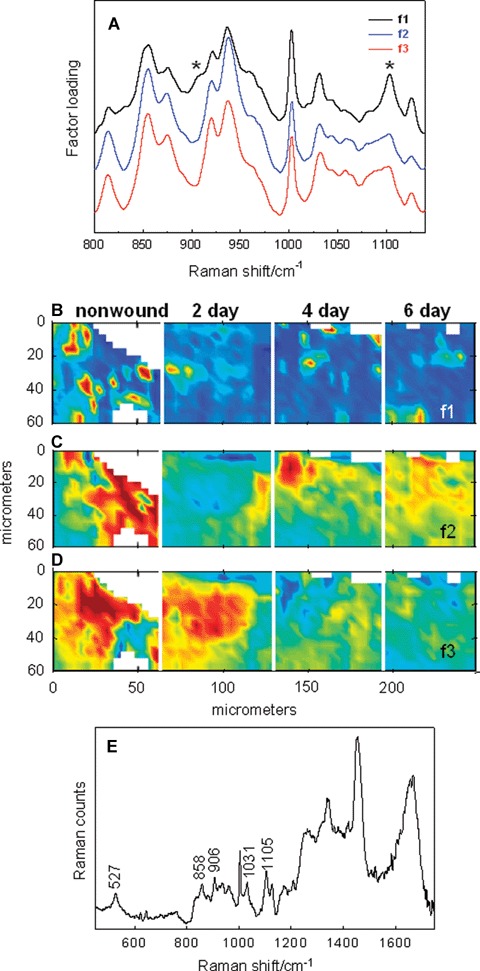
The repair of cutaneous wounds in the adult body involves a complex series of spatially and temporally organized processes to prevent infection and restore homeostasis. Three characteristic phases of wound repair (inflammation, proliferation including re-epithelialization and remodelling) overlap in time and space. We have utilized a human skin wound-healing model to correlate changes in genotype and pheno-type with infrared (IR) and confocal Raman spectroscopic images during the re-epithelialization of excisional wounds. The experimental protocols validated as IR images clearly delineate the keratin-rich migrating epithelial tongue from the collagen-rich wound bed. Multivariate statistical analysis of IR datasets acquired 6 days post-wounding reveal subtle spectral differences that map to distinct spatial distributions, which are correlated with immunofluorescent staining patterns of different keratin types. Images computed within collagen-rich regions expose complementary spatial patterns and identify elastin in the wound bed. The temporal sequence of events is explored through a comparison of gene array analysis with confocal Raman microscopy. Our approach demonstrates the feasibility of acquiring detailed molecular structure information from the various proteins and their subclasses involved in the wound-healing process.


Figures

Fig 1
Fig 1
Detection and IR characterization (factor analysis conducted over the 1475–1720 cm−1 region) of a migrating epithelial tongue (MET) in a wound-healing model, 4 days post-wounding. (A) Visible image of an unstained skin section depicting the wounded and non-wounded areas, along with the MET (marked with arrow). IR images were acquired of this same skin section. (B) IR score image for factor loading 1 (f1) highlighting collagen-rich areas of the sample. (C) IR score image for factor loading 2 (f2) highlighting keratin-rich areas. (D) Factor loadings overlaid with spectra averaged from corresponding regions of high scores. Factor loading 1 displays the typical Amide I and II features of collagen and f2 is typical for keratin. Colour coding of all score images: red > yellow > blue.
Fig 2
Fig 2
IR characterization (factor analysis conducted over the 1185–1475 cm−1 region) of wounded and non-wounded areas 6 days post-wounding. (A) Optical image of an unstained section with the edge of the wounded area marked. The MET is shown covering the wounded area on the right side of the micrograph. A tear is evident in the image of the thin section between the MET and the underlying provisional matrix. IR spectra were acquired of the same section and pixels corresponding to the tear were masked prior to statistical analysis. (B) The score image for f1 depicting the stratum corneum and part of the viable epidermis (red) of the non-wounded area in the skin section. (C) The score image for f2 highlights the spatial area of the suprabasal epidermis (red) proximal to the wound and in the MET. (D) The spatial distribution of high scores for f3 predominantly marks the basal epidermal layer in the non-wounded area. Scores are also somewhat higher (yellow) in the lower regions of the MET. (E) The score image for f4 illuminates the outer, leading edges of the MET (red). (F) The score image of f5 highlights a collagen-rich area directly under the MET. (G) The score image for f6 highlights a collagen-rich area that is continuous in both non-wounded and wounded (under the MET) regions. (H) Factor loadings used to generate the score images (B-G). Loadings f1-f4 are characteristic for keratin and map to keratin-rich spatial regions. High scores for f5 and f6 highlight collagen-rich areas.
Fig 4
Fig 4
Factor analysis of a confocal Raman dataset delineates skin regions near a wound edge 0.5 days post-wounding. Factor analysis was conducted over the 800–1140 cm−1 region yielding four loadings that map to anatomically distinct regions in skin. (A) The spatial distribution of scores for f1 highlights the stratum corneum region of the skin, rich in keratin-filled corneocytes and lipids. (B) Factor loading 2 shows high scores in the underlying epidermal region while high scores for f3 (C) reside near the dermal-epidermal boundary region. (D) The size, location and spatial distribution of several smaller regions with high scores for f4 are identified as cell nuclei. (E) Factor loadings reveal several spectral features specific to the microanatomy of the epidermis in human skin.
Fig 3
Fig 3
H&E, DAPI, and immunoflu-orescent keratin staining of healthy and acute wound sections as a function of healing time. (A) H&E stained sections. (B) Sections stained with K17-specific antibody and DAPI. (C) Sections stained with K14-specific antibody and DAPI.
Fig 5
Fig 5
Time-dependent events during wound healing monitored by confocal Raman microscopy and factor analysis (800–1140 cm"1 region). Spectra acquired in a non-wounded area (30-50 μm beneath the epidermis) and 2, 4 6 days post-wounding (in the centre the wound bed) are collectively analysed. (A) Three factor loadings for the concatenated dataset are overlaid. (B) Score image for f1 depicts the time-dependence of the elastin distribution pre- and post-wounding. (C and D) Temporal and spatial distribution of score images for f2 and f3 collagen-rich factors. (E) A difference spectrum based on the score image of f1 identifies elastin in the wound bed (see text for details).

References

    1. Coulombe PA. Wound epithelialization: accelerating the pace of discovery. J Invest Derinatol. 2003;121:219–30. - PubMed
    1. Singer AJ, Clark RAF. Cutaneous wound healing. NEngl JMed. 1999;341:738–46. - PubMed
    1. Freedberg IM, Tomic-Canic M, Komine M, Blumenberg M. Keratins and the ker-atinocyte activation cycle. J Invest Derinatol. 2001;116:633–40. - PubMed
    1. van Manen H-J, Kraan YM, Roos D, Otto C. Single-cell Raman and fluorescence microscopy reveal the association of lipid bodies with phagosomes in leukocytes. Proc Natl Acad Sci USA. 2005;102:10159–64. - PMC - PubMed
    1. Zhang G, Moore DJ, Flach CR, Mendelsohn R. Vibrational microscopy and imaging of skin: from single cells to intact tissue. Anal Bloanal Chem. 2007;387:1591–9. - PMC - PubMed

Publication types

MeSH terms