Apparent speed increases at low luminance
- PMID: 19146275
- PMCID: PMC2792706
- DOI: 10.1167/8.16.9
Apparent speed increases at low luminance
Abstract
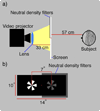
To investigate the effect of luminance on apparent speed, subjects adjusted the speed of a low-luminance rotating grating (0.31 cd/m(2)) to match that of a high-luminance one (1260 cd/m(2)). Above 4 Hz, subjects overestimated the speed of the low-luminance grating. This overestimation increased as a function of temporal rate and reached 30% around 10 Hz temporal rates. The speed overestimation became significant once the lower luminance was 2.4 log units lower than the high luminance comparison. Next the role of motion smear in speed overestimation was examined. First it was shown that the length of the perceived motion smear increased at low luminances. Second, the length of the visible smear was manipulated by changing the presentation time of the stimuli. Speed overestimation was reduced at shorter presentation times. Third the speed of a blurred stimulus was compared to a stimulus with sharp edges and the blurred stimulus was judged to move faster. These results indicate that the length of motion smear following a target contributes to its perceived speed and that this leads to speed overestimation at low luminance where motion traces lengthen because of increased persistence.
Figures


Similar articles
-
Spatiotemporal averaging of perceived brightness along an apparent motion trajectory.J Vis. 2011 Jun 8;11(7):5. doi: 10.1167/11.7.5. J Vis. 2011. PMID: 21652772
-
Misperceptions of speed for chromatic and luminance grating stimuli.Vision Res. 2007 May;47(11):1504-17. doi: 10.1016/j.visres.2006.12.020. Epub 2007 Mar 28. Vision Res. 2007. PMID: 17395238
-
Luminance texture increases perceived speed.Vision Res. 2007 Mar;47(5):723-34. doi: 10.1016/j.visres.2006.11.011. Epub 2007 Feb 1. Vision Res. 2007. PMID: 17275059
-
Duration expansion at low luminance levels.J Vis. 2011 Dec 13;11(14):13. doi: 10.1167/11.14.13. J Vis. 2011. PMID: 22167051
-
Motion direction, luminance contrast, and speed perception: An unexpected meeting.J Vis. 2019 Jun 3;19(6):16. doi: 10.1167/19.6.16. J Vis. 2019. PMID: 31206138
Cited by
-
Suboptimality in perceptual decision making.Behav Brain Sci. 2018 Feb 27;41:e223. doi: 10.1017/S0140525X18000936. Behav Brain Sci. 2018. PMID: 29485020 Free PMC article.
-
Misperceptions of speed are accounted for by the responses of neurons in macaque cortical area MT.J Neurophysiol. 2011 Mar;105(3):1199-211. doi: 10.1152/jn.00213.2010. Epub 2010 Dec 29. J Neurophysiol. 2011. PMID: 21191092 Free PMC article.
-
Effect of speed overestimation on flash-lag effect at low luminance.Iperception. 2011;2(9):1063-75. doi: 10.1068/i0435. Epub 2011 Dec 19. Iperception. 2011. PMID: 23145261 Free PMC article.
-
Implicit representations of luminance and the temporal structure of moving stimuli in multiple regions of human visual cortex revealed by multivariate pattern classification analysis.J Neurophysiol. 2013 Aug;110(3):688-99. doi: 10.1152/jn.00359.2012. Epub 2013 May 15. J Neurophysiol. 2013. PMID: 23678010 Free PMC article.
-
Suprathreshold Motion Perception in Anisometropic Amblyopia: Interocular Speed Matching and the Pulfrich Effect.Optom Vis Sci. 2019 Jun;96(6):434-442. doi: 10.1097/OPX.0000000000001381. Optom Vis Sci. 2019. PMID: 31107841 Free PMC article.
References
-
- Adelson EH, Bergen JR. Spatiotemporal energy models for the perception of motion. Journal of the Optical Society of America A, Optics and Image Science. 1985;2:284–299. - PubMed
-
- Afraz SR, Kiani R, Vaziri-Pashkam M, Esteky H. Motion-induced overestimation of the number of items in a display. Perception. 2004;33:915–925. - PubMed
-
- Barlow HB, Olshausen BA. Convergent evidence for the visual analysis of optic flow through anisotropic attenuation of high spatial frequencies. Journal of Vision. 2004;4(6):1, 415–426. http://journalofvision.org/4/6/1/, doi:10.1167/4.6.1. - PubMed
-
- Burr D. Motion vision: Are ‘speed lines’ used in human visual motion? Current Biology. 2000;10:R440–R443. - PubMed
Publication types
MeSH terms
Grants and funding
LinkOut - more resources
Full Text Sources

