

Neural processing underlying tactile microspatial discrimination in the blind: a functional magnetic resonance imaging study
- PMID: 19146355
- PMCID: PMC3063091
- DOI: 10.1167/8.10.13
Neural processing underlying tactile microspatial discrimination in the blind: a functional magnetic resonance imaging study
Abstract
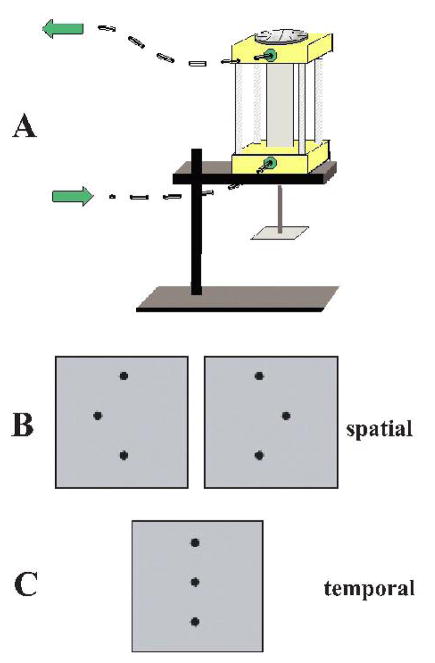
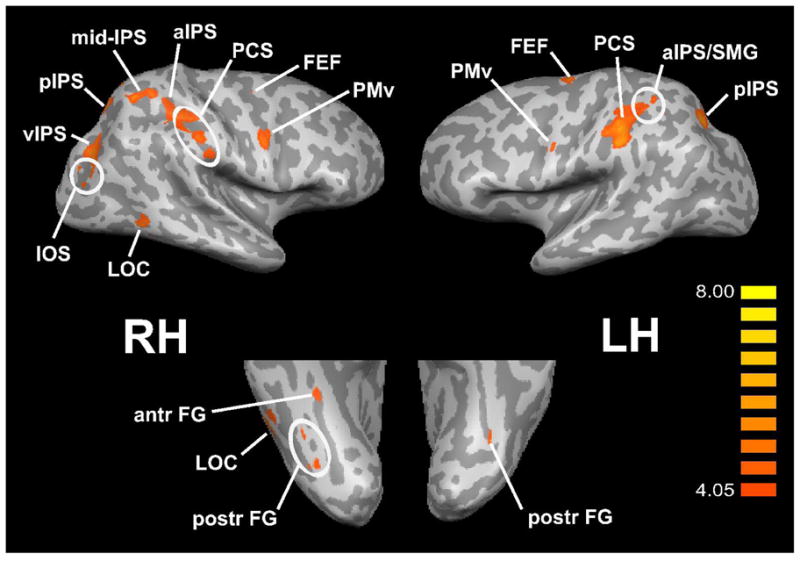
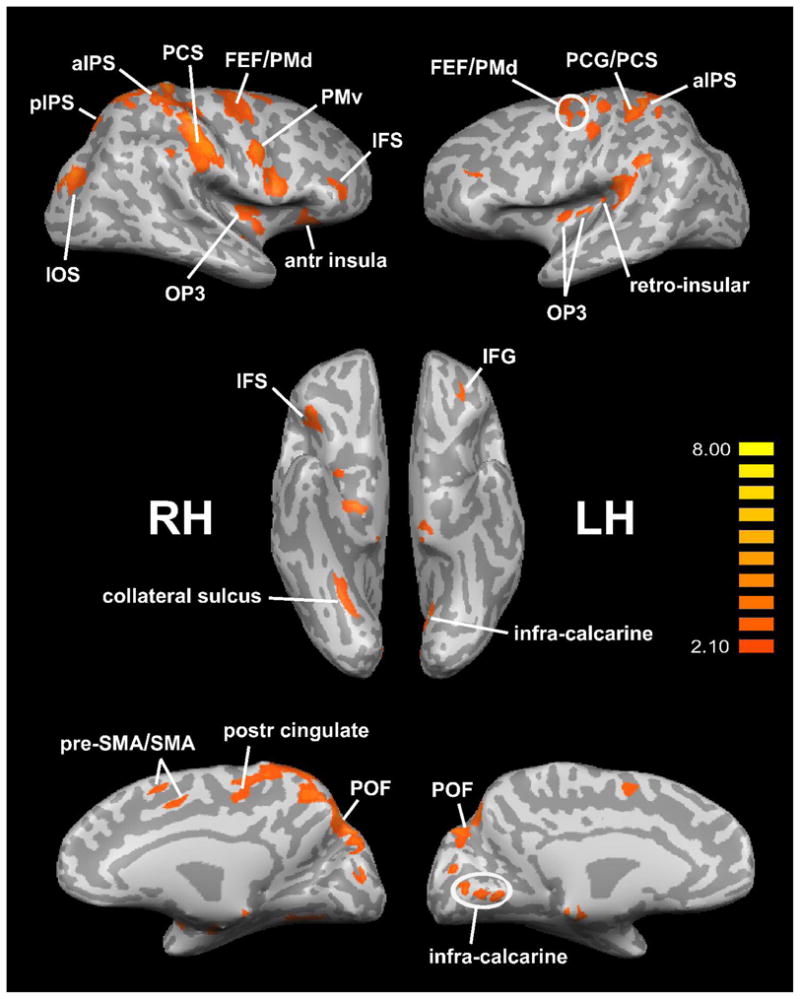
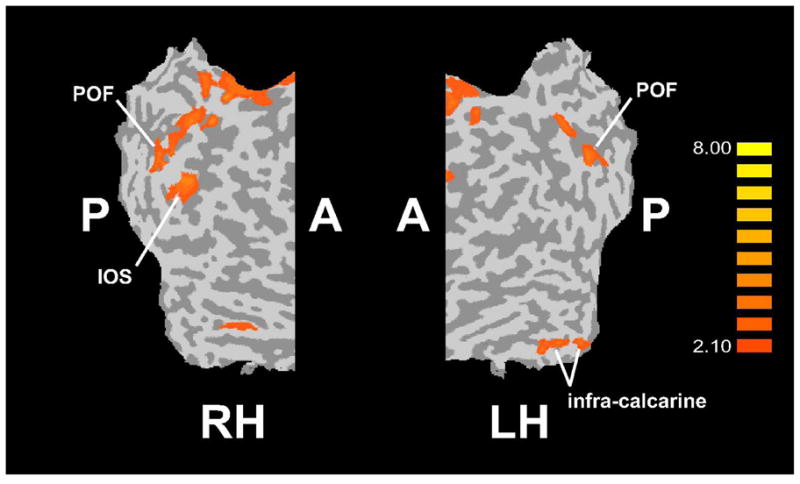
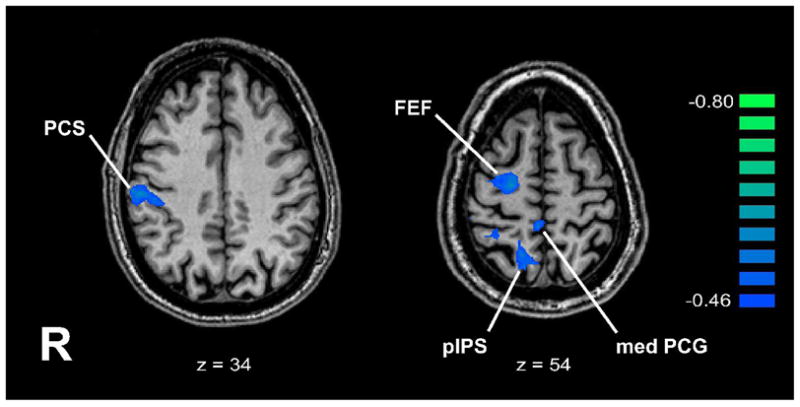
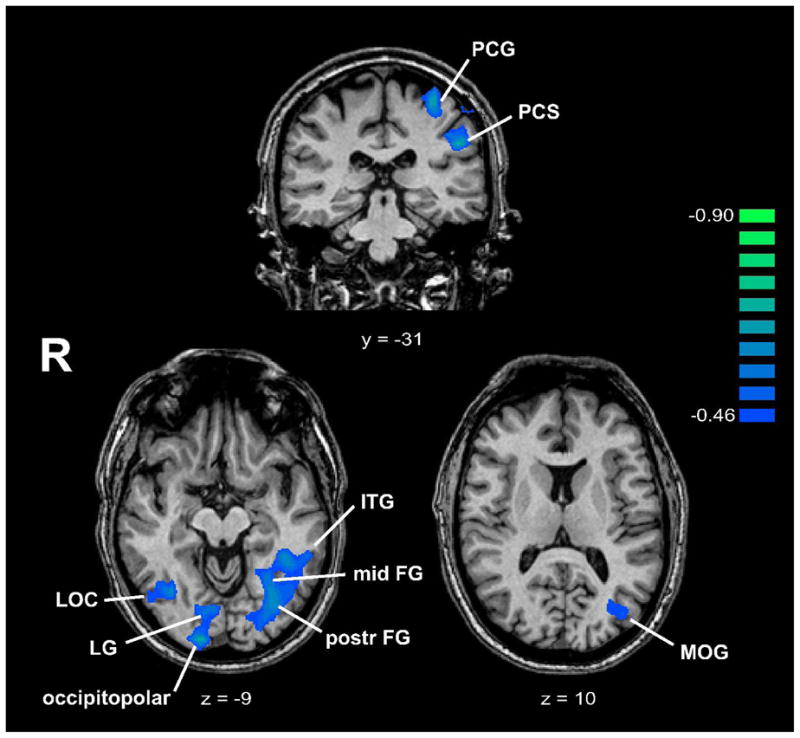
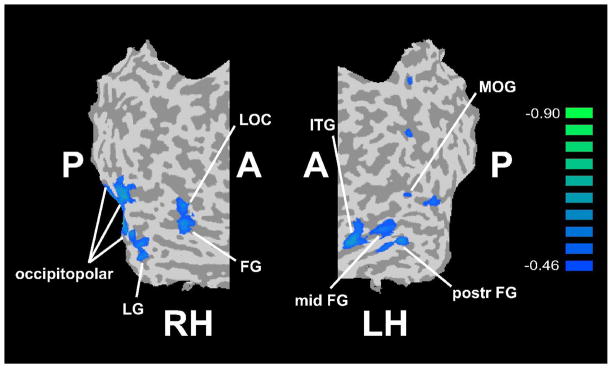
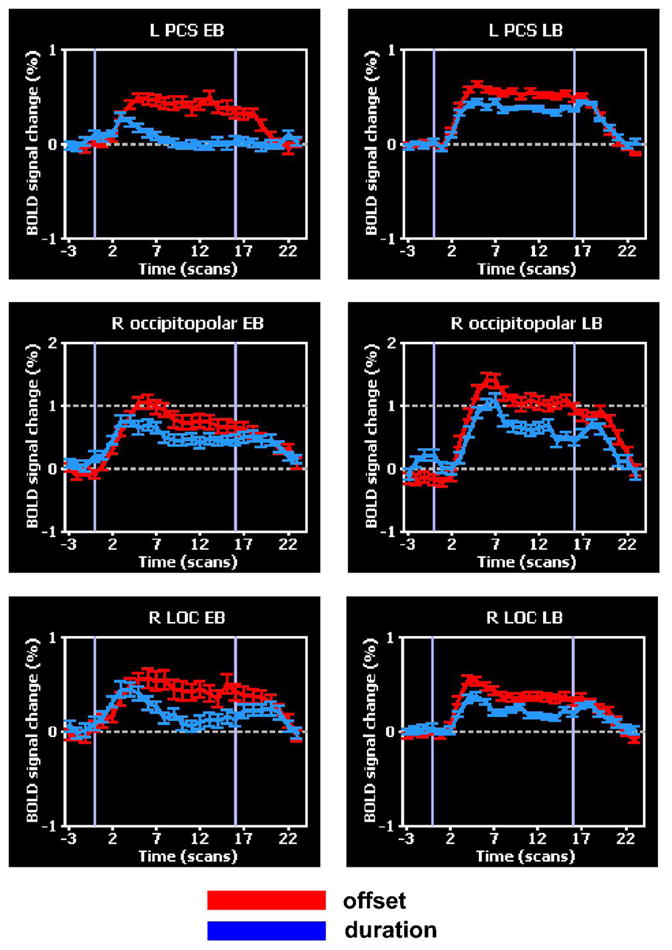
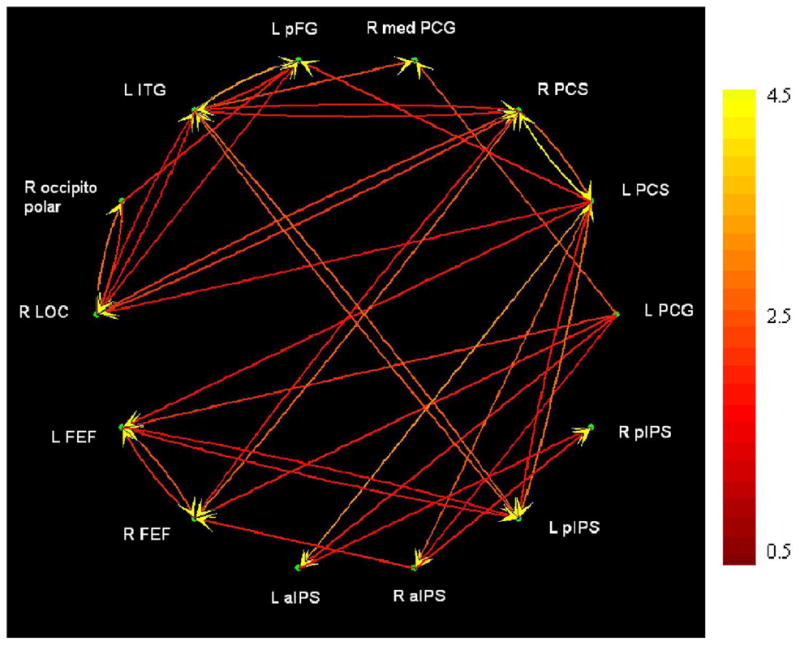
Although blindness alters neocortical processing of non-visual tasks, previous studies do not allow clear conclusions about purely perceptual tasks. We used functional magnetic resonance imaging (fMRI) to examine the neural processing underlying tactile microspatial discrimination in the blind. Activity during the tactile microspatial task was contrasted against that during a tactile temporal discrimination task. The spatially selective network included frontoparietal and visual cortical regions. Activation magnitudes in left primary somatosensory cortex and in visual cortical foci predicted acuity thresholds. Effective connectivity was investigated using multivariate Granger causality analyses. Bilateral primary somatosensory cortical foci and a left inferior temporal focus were important sources of connections. Visual cortical regions interacted mainly with one another and with somatosensory cortical regions. Among a set of distributed cortical regions exhibiting greater spatial selectivity in early blind compared to late blind individuals, the age of complete blindness was predicted by activity in a subset of frontoparietal regions and by the weight of a path from the right lateral occipital complex to right occipitopolar cortex. Thus, many aspects of neural processing during tactile microspatial discrimination differ between the blind and sighted, with some of the key differences reflecting visual cortical engagement in the blind.
Figures
References
-
- Alho K, Kujala T, Paavilainen P, Summala H, Näätänen R. Auditory processing in visual brain areas of the early blind: evidence from event-related potentials. Electroencephalography and Clinical Neurophysiology. 1993;86:418–427. - PubMed
-
- Amedi A, Floel A, Knecht S, Zohary E, Cohen LG. Transcranial magnetic stimulation of the occipital pole interferes with verbal processing in blind subjects. Nature Neuroscience. 2004;7:1266–70. - PubMed
-
- Amedi A, Raz N, Pianka P, Malach R, Zohary E. Early ‘visual’ cortex activation correlates with superior verbal memory performance in the blind. Nature Neuroscience. 2003;6:758–766. - PubMed
-
- Büchel C, Price C, Frackowiak RSJ, Friston K. Different activation patterns in the visual cortex of late and congenitally blind subjects. Brain. 1998;121:409–419. - PubMed
-
- Büchel C, Price C, Friston K. A multimodal language region in the ventral visual pathway. Nature. 1998;394:274–277. - PubMed
Publication types
MeSH terms
Grants and funding
LinkOut - more resources
Full Text Sources
