. 2009 Feb 18;131(6):2397-403.
doi: 10.1021/ja8088636.

Transition-state geometry measurements from (13)c isotope effects. The experimental transition state for the epoxidation of alkenes with oxaziridines

Affiliations

Transition-state geometry measurements from (13)c isotope effects. The experimental transition state for the epoxidation of alkenes with oxaziridines

Jennifer S Hirschi et al. J Am Chem Soc. .

Abstract

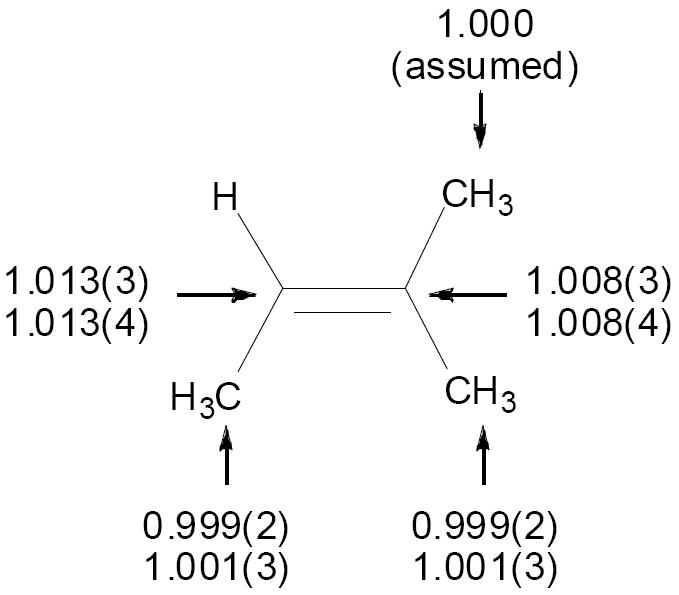
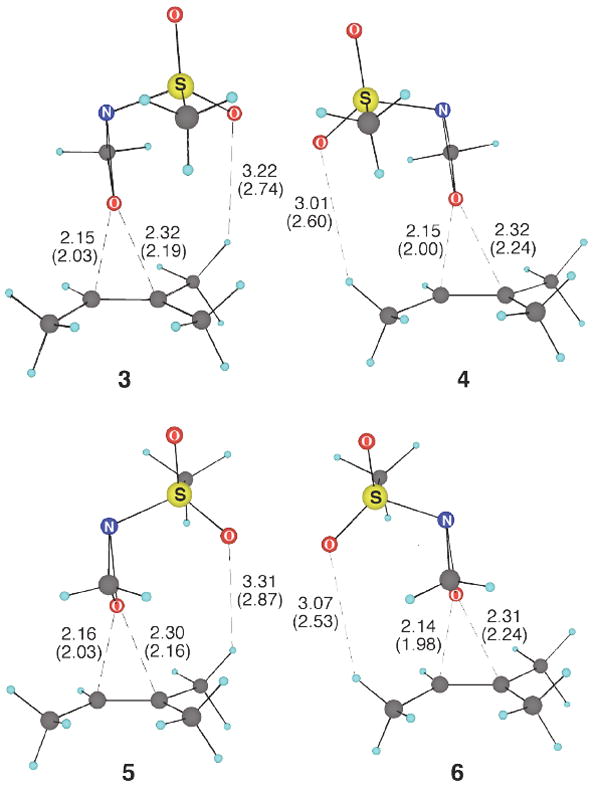
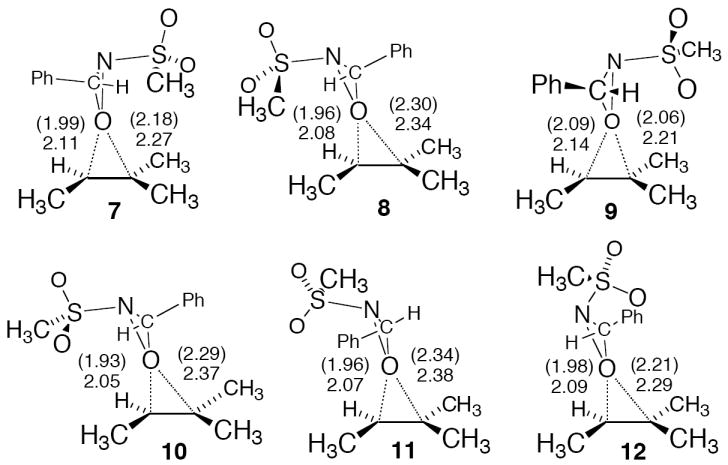
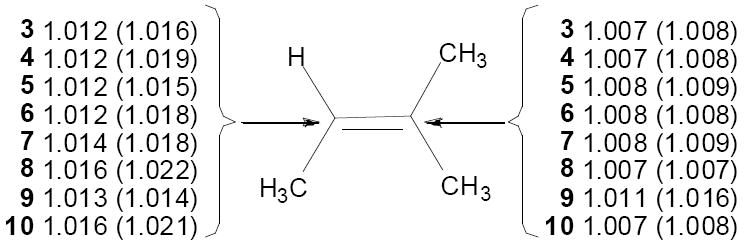
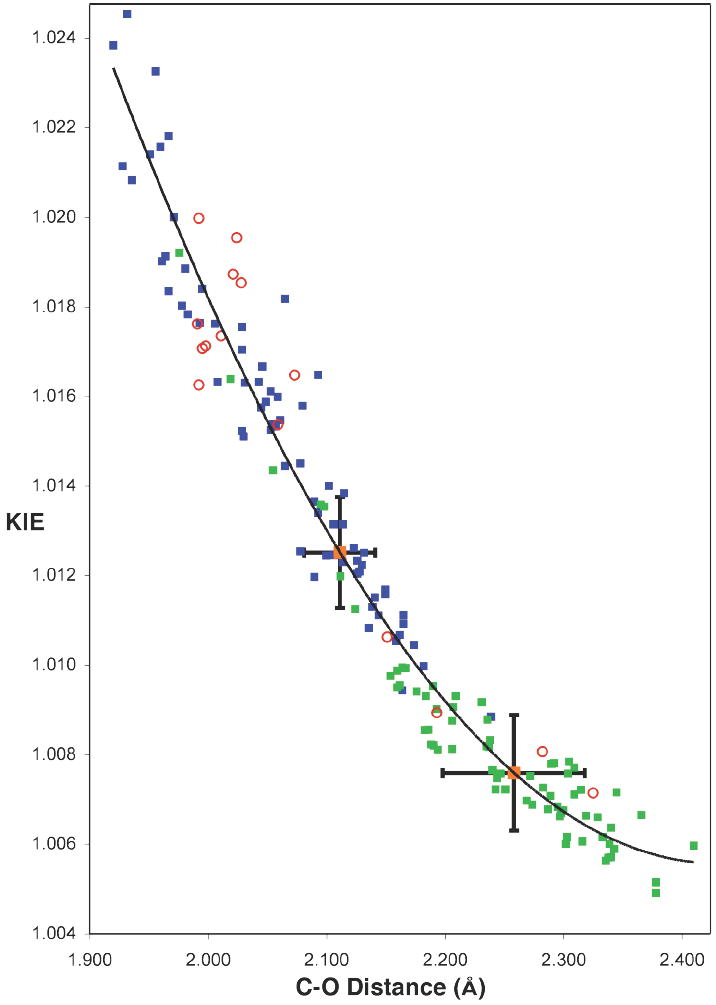
We here suggest and evaluate a methodology for the measurement of specific interatomic distances from a combination of theoretical calculations and experimentally measured (13)C kinetic isotope effects. This process takes advantage of a broad diversity of transition structures available for the epoxidation of 2-methyl-2-butene with oxaziridines. From the isotope effects calculated for these transition structures, a theory-independent relationship between the C-O bond distances of the newly forming bonds and the isotope effects is established. Within the precision of the measurement, this relationship in combination with the experimental isotope effects provides a highly accurate picture of the C-O bonds forming at the transition state. The diversity of transition structures also allows an evaluation of the Schramm process for defining transition-state geometries on the basis of calculations at nonstationary points, and the methodology is found to be reasonably accurate.


Figures

Figure 1
Figure 1
Experimental 13C KIEs (k12C/k13C, 25 °C) for the epoxidation of 2-methyl-2-butene with 1. The two sets of KIEs refer to two independent experiments, with each result based on the average of six measurements. Standard deviations in the last digit are shown in parentheses.
Figure 2
Figure 2
The four lowest-energy B3LYP/6-31+G** transition structures for the epoxidation of 2-methyl-2-butene with 2-(methylsulfonyl)oxaziridine. Distances (Å) in parentheses are from gas-phase optimizations, and distances without parentheses are from optimizations using a PCM implicit solvation model.
Figure 3
Figure 3
The B3LYP/6-31+G** transition structures for the epoxidation of 2-methyl-2-butene with trans-3-phenyl-2-methanesulfonyloxaziridine (7-10) and cis-3-phenyl-2-methanesulfonyloxaziridine (11 and 12). Distances (Å) in parentheses are from gas-phase optimizations, and distances without parentheses are from optimizations using a PCM implicit solvent model.
Figure 4
Figure 4
Predicted 13C KIEs (k12C / k13C) are shown for the olefinic carbons of transition state structures 3-10 for the epoxidation of 2-methyl-2-butene catalyzed by 2-(methylsulfonyl)oxaziridine (36) and trans-3-phenyl-2-methanesulfonyloxaziridine (7-10). Predicted KIEs from gas-phase optimizations are shown in parentheses, and KIEs from optimizations with an implicit PCM solvent model are shown without parentheses.
Figure 5
Figure 5
Relationship between 13C KIEs (k12C / k13C) and C–O bond distance of the newly forming olefinic bonds in the oxaziridination of 2-methyl-2-butene. Predictions were calculated from a variety of B3LYP optimized structures for C3 (blue squares) and C2 (green squares). A quadratic line is fit to all B3LYP points. Predictions from other theoretical methods with reasonable energetic barriers (BPW91, B3PW91, BP86, MPW3LYP, MPWLYP1M, MPW1B95, TPSSKCIS, PBE1KCIS) are also depicted (red open circles). Absolute experimental KIEs of 1.0125 and 1.0075 are shown (orange squares), with the uncertainties from a combination of experimental measurements. The absolute experimental KIEs (rather than the relative experimental KIEs in Figure 1) are represented here to facilitate comparison with the absolute predicted values. Absolute experimental values were determined as the product of each experimental measurement and the average of all predicted KIEs at C5 (0.9994).

References

    1. For an exception, see: Wenthold PG, Hrovat DA, Borden WT, Lineberger WC. Science. 1996;272:1456–1459.

    1. Bigeleisen J, Wolfsberg M. Advances in chemical physics. Vol. 1. Interscience; New York: 1958. pp. 16–76.
    2. Melander L, Saunders WH., Jr . Isotope effects on reaction rates. Wiley-Interscience; New York: 1980.
    3. More O’ Ferrall RA. J Chem Soc B. 1970:785–790.
    4. Katz AM, Saunders WH., Jr J Am Chem Soc. 1969;91:4469–4472.
    5. Streitwieser A, Jr, Jagow RH, Suzuki S. J Am Chem Soc. 1958;80:2326–2332.
    1. Hess BA, Jr, Schaad LJ, Pancir J. J Am Chem Soc. 1985;107:149–154.
    2. Baldwin JE, Reddy VP, Hess BA, Jr, Schaad LJ. J Am Chem Soc. 1988;110:8554–8555.
    1. Lu D-h, Maurice D, Truhlar DG. J Am Chem Soc. 1990;112:6206–6214.
    1. Beno BR, Houk KN, Singleton DA. J Am Chem Soc. 1996;118:9984–9985.

Publication types