The relationship between magnetic and electrophysiological responses to complex tactile stimuli
- PMID: 19146670
- PMCID: PMC2652466
- DOI: 10.1186/1471-2202-10-4
The relationship between magnetic and electrophysiological responses to complex tactile stimuli
Abstract
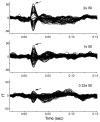
Background: Magnetoencephalography (MEG) has become an increasingly popular technique for non-invasively characterizing neuromagnetic field changes in the brain at a high temporal resolution. To examine the reliability of the MEG signal, we compared magnetic and electrophysiological responses to complex natural stimuli from the same animals. We examined changes in neuromagnetic fields, local field potentials (LFP) and multi-unit activity (MUA) in macaque monkey primary somatosensory cortex that were induced by varying the rate of mechanical stimulation. Stimuli were applied to the fingertips with three inter-stimulus intervals (ISIs): 0.33s, 1s and 2s.
Results: Signal intensity was inversely related to the rate of stimulation, but to different degrees for each measurement method. The decrease in response at higher stimulation rates was significantly greater for MUA than LFP and MEG data, while no significant difference was observed between LFP and MEG recordings. Furthermore, response latency was the shortest for MUA and the longest for MEG data.
Conclusion: The MEG signal is an accurate representation of electrophysiological responses to complex natural stimuli. Further, the intensity and latency of the MEG signal were better correlated with the LFP than MUA data suggesting that the MEG signal reflects primarily synaptic currents rather than spiking activity. These differences in latency could be attributed to differences in the extent of spatial summation and/or differential laminar sensitivity.
Figures


Similar articles
-
MEG in the macaque monkey and human: distinguishing cortical fields in space and time.Brain Res. 2010 Jul 23;1345:110-24. doi: 10.1016/j.brainres.2010.05.037. Epub 2010 May 20. Brain Res. 2010. PMID: 20493828 Free PMC article.
-
Imaging human cortical responses to intraneural microstimulation using magnetoencephalography.Neuroimage. 2019 Apr 1;189:329-340. doi: 10.1016/j.neuroimage.2019.01.017. Epub 2019 Jan 9. Neuroimage. 2019. PMID: 30639839 Free PMC article.
-
Adaptive changes in the neuromagnetic response of the primary and association somatosensory areas following repetitive tactile hand stimulation in humans.Hum Brain Mapp. 2013 Jun;34(6):1415-26. doi: 10.1002/hbm.21519. Epub 2012 Feb 14. Hum Brain Mapp. 2013. PMID: 22331631 Free PMC article.
-
Neuromagnetic integrated methods tracking human brain mechanisms of sensorimotor areas 'plastic' reorganisation.Brain Res Brain Res Rev. 2000 Sep;33(2-3):131-54. doi: 10.1016/s0169-328x(00)00090-5. Brain Res Brain Res Rev. 2000. PMID: 11011062 Review.
-
Tracking functions of cortical networks on a millisecond timescale.Neural Netw. 2000 Oct-Nov;13(8-9):883-9. doi: 10.1016/s0893-6080(00)00061-7. Neural Netw. 2000. PMID: 11156199 Review.
Cited by
-
Neural mechanisms of transient neocortical beta rhythms: Converging evidence from humans, computational modeling, monkeys, and mice.Proc Natl Acad Sci U S A. 2016 Aug 16;113(33):E4885-94. doi: 10.1073/pnas.1604135113. Epub 2016 Jul 28. Proc Natl Acad Sci U S A. 2016. PMID: 27469163 Free PMC article.
-
Neurophysiological signatures of cortical micro-architecture.Nat Commun. 2023 Sep 26;14(1):6000. doi: 10.1038/s41467-023-41689-6. Nat Commun. 2023. PMID: 37752115 Free PMC article.
-
Distinguishing mechanisms of gamma frequency oscillations in human current source signals using a computational model of a laminar neocortical network.Front Hum Neurosci. 2013 Dec 18;7:869. doi: 10.3389/fnhum.2013.00869. eCollection 2013. Front Hum Neurosci. 2013. PMID: 24385958 Free PMC article.
-
Neurophysiological signatures of cortical micro-architecture.bioRxiv [Preprint]. 2023 Jan 23:2023.01.23.525101. doi: 10.1101/2023.01.23.525101. bioRxiv. 2023. Update in: Nat Commun. 2023 Sep 26;14(1):6000. doi: 10.1038/s41467-023-41689-6. PMID: 36747831 Free PMC article. Updated. Preprint.
-
Quantitative analysis and biophysically realistic neural modeling of the MEG mu rhythm: rhythmogenesis and modulation of sensory-evoked responses.J Neurophysiol. 2009 Dec;102(6):3554-72. doi: 10.1152/jn.00535.2009. Epub 2009 Oct 7. J Neurophysiol. 2009. PMID: 19812290 Free PMC article.
References
-
- Hamalainen M, Hari R, Ilmoniemi R, Knuutila J, Lounasmaa O. Magnetoencephalography. Theory, instrumentation and applications to the noninvasive study of human brian function. Rev Med Phy. 1993;65:413–497. doi: 10.1103/RevModPhys.65.413. - DOI
-
- Baillet S, Mosher JC, Leahy RM. Electromagnetic Brain Mapping. IEEE Signal Processing Magazine. 2001;18:14–30. doi: 10.1109/79.962275. - DOI

