. 2009 Feb 27;386(3):648-61.
doi: 10.1016/j.jmb.2008.12.035. Epub 2008 Dec 24.

Stochastic gating and drug-ribosome interactions

Affiliations

Stochastic gating and drug-ribosome interactions

Andrea C Vaiana et al. J Mol Biol. .

Abstract

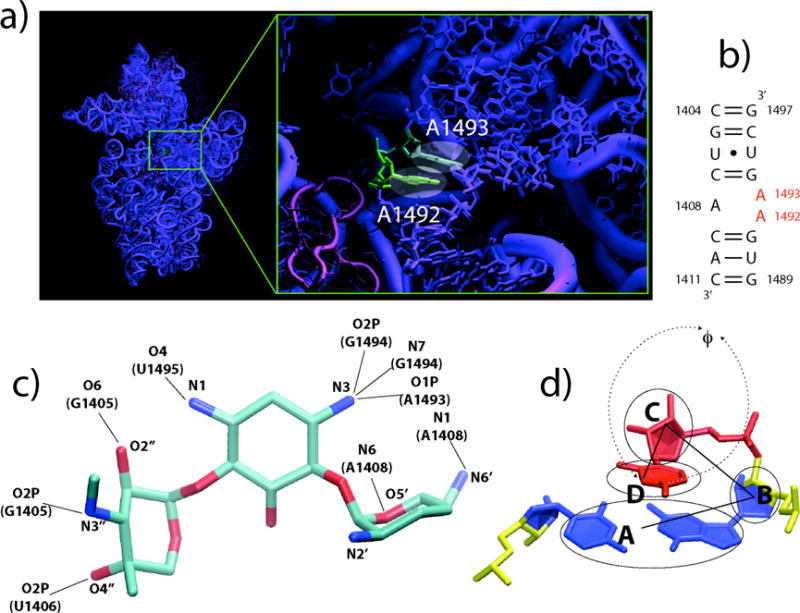
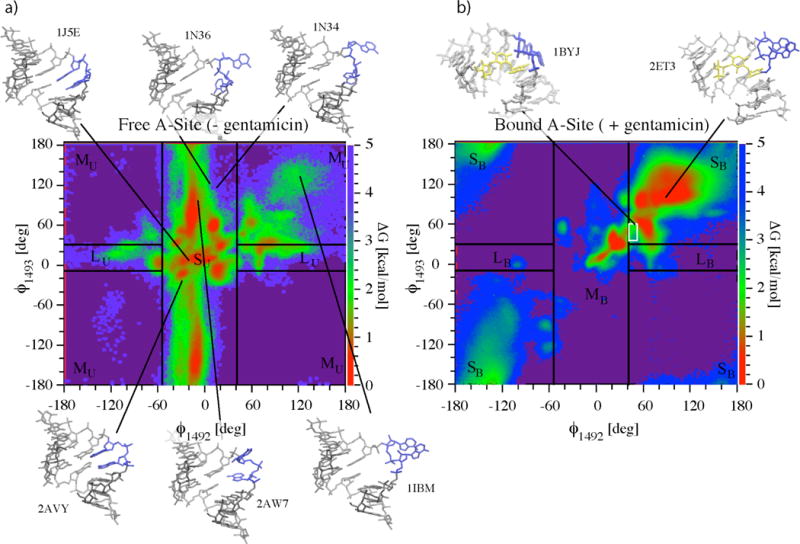
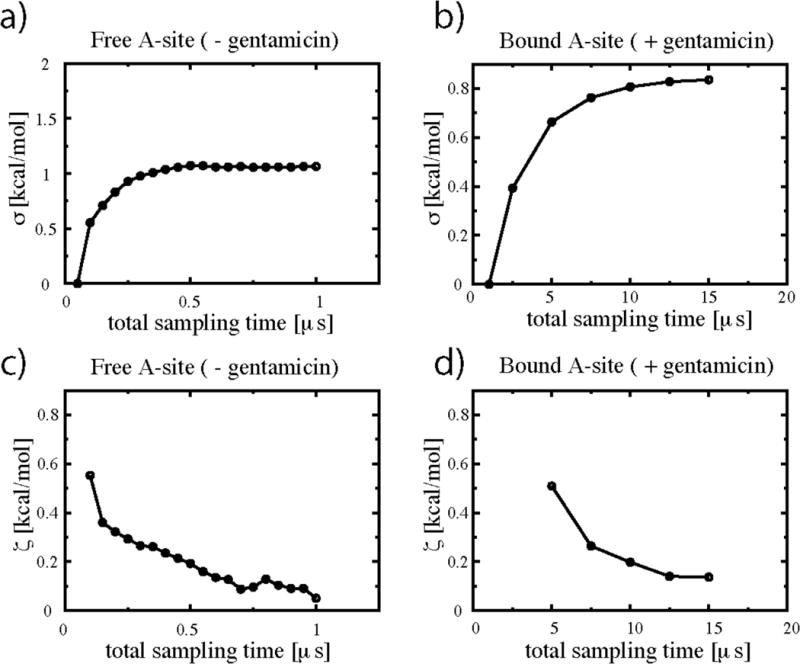
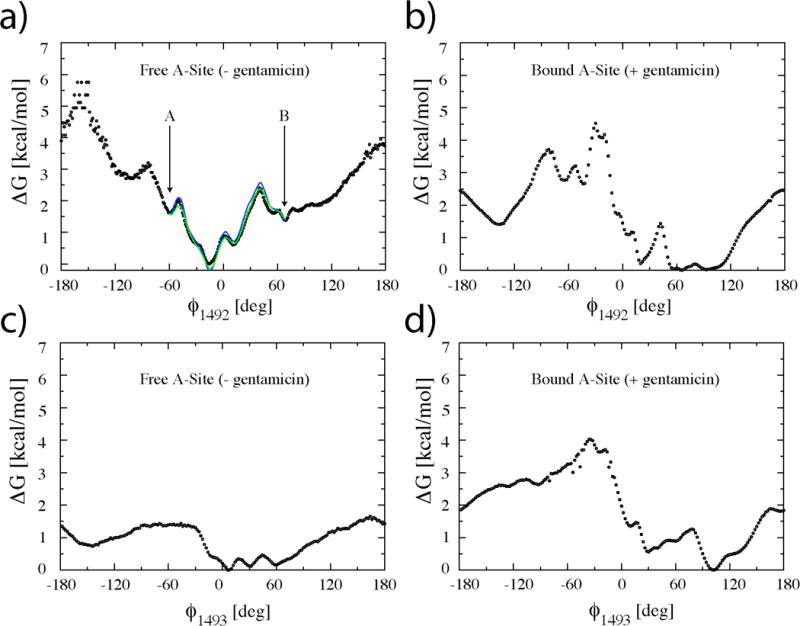
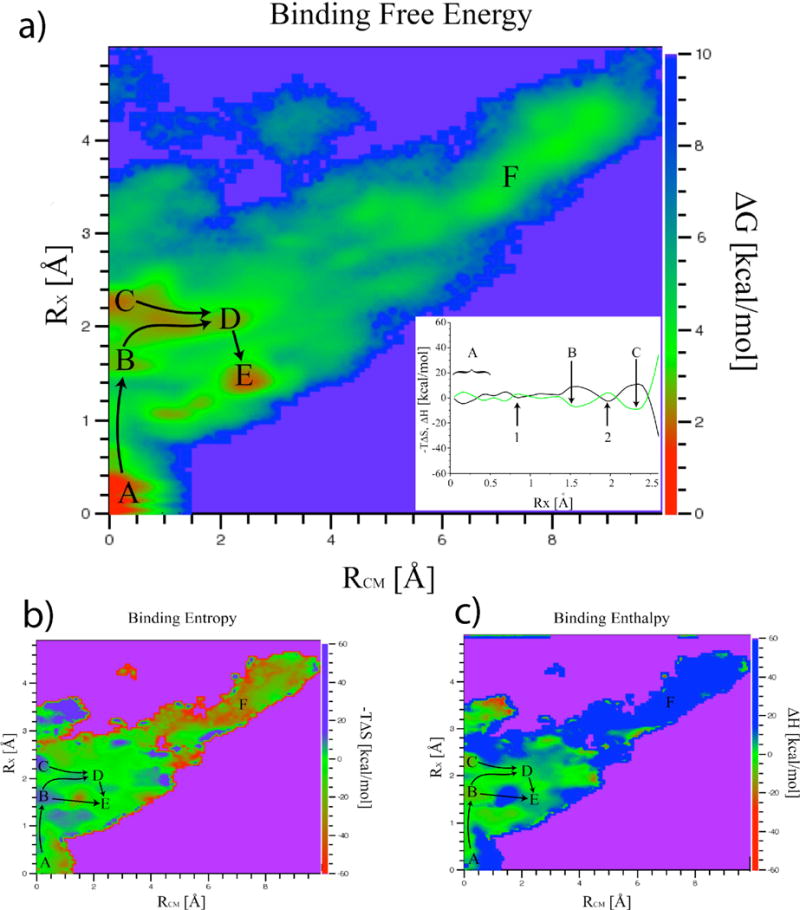
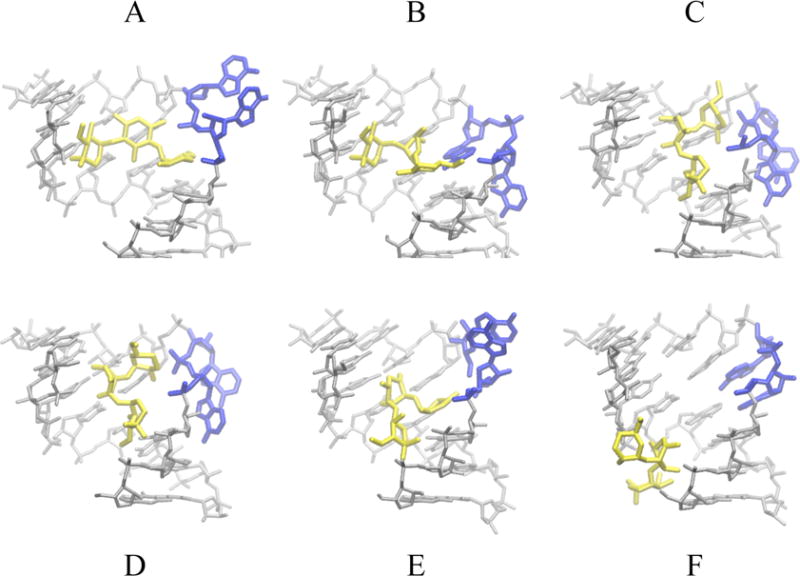
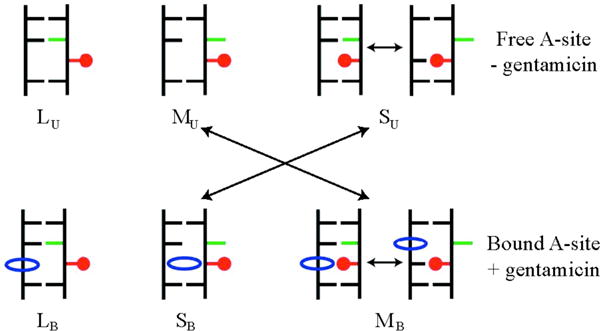
Gentamicin is a potent antibiotic that is used in combination therapy for inhalation anthrax disease. The drug is also often used in therapy for methicillin-resistant Staphylococcusaureus. Gentamicin works by flipping a conformational switch on the ribosome, disrupting the reading head (i.e., 16S ribosomal decoding bases 1492-1493) used for decoding messenger RNA. We use explicit solvent all-atom molecular simulation to study the thermodynamics of the ribosomal decoding site and its interaction with gentamicin. The replica exchange molecular dynamics simulations used an aggregate sampling of 15 mus when summed over all replicas, allowing us to explicitly calculate the free-energy landscape, including a rigorous treatment of enthalpic and entropic effects. Here, we show that the decoding bases flip on a timescale faster than that of gentamicin binding, supporting a stochastic gating mechanism for antibiotic binding, rather than an induced-fit model where the bases only flip in the presence of a ligand. The study also allows us to explore the nonspecific binding landscape near the binding site and reveals that, rather than a two-state bound/unbound scenario, drug dissociation entails shuttling between many metastable local minima in the free-energy landscape. Special care is dedicated to validation of the obtained results, both by direct comparison to experiment and by estimation of simulation convergence.


Figures

Figure 1
Figure 1
The ribosomal A site and gentamicin. a) The A site in the context of the 30S ribosomal subunit. b) Secondary structure of the simulated A site. c) Gentamicin structure from reference 17, the nine crystal contacts to the A site are evidenced. d) Definition of the flipping angle F used here to characterize the flipped in/out states of A1492 and A1493, taken from reference 49. For a given base, F is defined as the pseudo-dihedral angle determined by points A, B, C and D, where A is the center of mass of the neighboring base pair, B is that of the neighboring sugar, C is that of the sugar of the base itself and D that of the base.
Figure 2
Figure 2
Two-dimensional free energy landscapes as a function of base flipping coordinates F1492 and F1493 resulting from simulations S1 (a) and S2 (b) for the flipping of A1492 and A1493. Starting x-ray structures used for the two simulations and relative PDB accession codes are shown along with one NMR ensemble structure (1BYJ),,,,,. Arrows evidence the position of the corresponding structures on the (F1492, F1493) plane. The 37 structures from the NMR ensemble for the bound state all lay within the white box in (b). Lines delimiting areas S, M, and L (with subscript U for the unbound state) correspond to values F1492,min=−41°, F1493,min, F1492,max=55° and F1492,max. These were obtained by matching time-resolved fluorescence amplitudes from reference to the probability amplitudes from simulation S1 of finding the system in areas S, M, and L described in text (a). The same experimentally calibrated values of F1492,min, F1493,min, F1492,max and F1492,max are applied to the free energy landscape of the gentamicin simulation (subscript B for bound state) in (b).
Figure 3
Figure 3
Convergence and fluctuation estimates for the free energy landcapes of Fig. 2. (a) and (c) refer to simulation S1; (b) and (d) to simulation S2. Convergence was estimated by calculating the deviation σ (t) (eq. 1a), of the two dimensional cumulative PMF landscapes DGflip(F1492, F1493)t obtained after time t from those obtained at time t0. Values of σ approach a plateau indicating convergence after ~0.5 ms in the case of the free A site and after ~12ms in that of the gentamicin/A site complex. Fluctuations ς (t) were similarly derived using eq. 1b. Values of ς (t) remain below 0.2 kcal/mol in the plateau region for both simulations.
Figure 4
Figure 4
One-dimensional free energy landscapes as a function of base flipping coordinates F1492 and F1493 resulting from simulations S1 (a and c) and S2 (b and d) for the flipping of A1492 and A1493. A1492 is confined to mostly flipped-in states in the absence of gentamicin (a), whereas A1493 is highly mobile (c). Gentamicin binding to the A site shifts the equilibrium from flipped-in states to flipped-out states of both A1492 and A1493. The blue curve in (a) represents the effective free energy as re-derived between points A and B from simulation S1 using the solution of the steady state Fokker-Planck equation and not directly from the simulation data. The green curve in (a) represents the homogeneous diffusion approximation, to the effective free energy. Both curves are in good agreement with the free energies derived directly from eq. 3 (black circles).
Figure 5
Figure 5
Gentamicin binding and unbinding pathways. Two dimensional binding free energy (a), entropy (b) and enthalpy (c) landscapes obtained at T=300K are shown as a function of coordinates RCM and RX. It should be noted that direct entropic contributions to the free energy are plotted here (−TDS). The global minimum of the binding free energy landscape, labeled A, corresponds to the crystallographic structure (RX ~ RCM ~ 0 Å). Inside the binding site (RCM < 3.0 Å) the landscape is very rugged and characterized by the presence of several local minima. Points B through E are kinetic traps within the binding site. Lowest free energy pathways connecting the minima are evidenced. Entropy/enthalpy-dominated regions red to yellow areas of (b)/(c) respectively are scattered across the landscape and not limited to bound states. The inset in a) shows the entropy (black) and enthalpy (green) contributions to the free energy along the path connecting minima A, B and C. Points 1 and 2 along the path are typical examples of entropy shuttling states. States within minima labeled B and C are enthalpy-dominated whereas those labeled D, E and F are entropy-dominated. Escape to the unbound region F involves crossing several barriers where entropy “shuttling” plays a crucial role. It should be noted that the range spanned by the energy scales is very different for the free energy and for its entropic/enthalpic components. This is at the origin of the well known phenomenon of entropy-enthalpy compensation clearly visible in the inset of a).
Figure 6
Figure 6
Representative structures of the gentamicin and RNA in states labeled A through F in Figure 5 extracted from simulation S2. Gentamicin is shown in yellow, decoding bases A1492 and A1493 in blue. These adopt a flipped-out conformation in state A with the drug in the binding pocket, as in the x-ray structure. In state B, A1492 is flipped-out and A1493 is flipped-in and interacts with ring 1 of Gentamicin. Both States C and D show A1492 and A1493 flipped-out. Interactions with the RNA are weaker here than those of states A and B. Finally, state E shows both A1492 and A1493 flipped in with few interactions between the antibiotic and the ribosome. In state F Gentamicin has completely left the binding site.
Figure 7
Figure 7
Schematic representation of hypothetical fluorescent states for the A1492/2AP1492 substituted A site (top) and aminoglycoside/A site complexes (bottom) as measured in reference. The 2AP in position 1492 is represented in red, A1493 in green and the antibiotic in blue. The longest measured lifetime (lowest quenching probability), labeled LU for the unbound state and LB for the bound one, corresponds to configurations with 2AP1492 flipped-out and A1493 flipped-in in both the bound and unbound states. In absence of bound antibiotics, the shortest measured lifetime (highest quenching probability), labeled SU, corresponds to highly populated intra-helical stacked conformations of 2AP1492. Aminoglycoside binding to the A site shifts the highly populated states to extra-helical stacked SB states of 2AP. In absence of aminoglycosides to the A site the experimental lifetimes are: i) SU, τS = 0.31ns, this corresponds to an intra-helical stacking of A1492 (highly quenched state); ii) MU, τM=2.85ns, this corresponds to extra-helical stacking between A1492 and A1493; iii) LU τL=9.21ns, this corresponds to configurations in which A1492 is not involved in stacking interactions, i.e. A1492 in an extra-helical state with A1493 inside the helix. The relative fluorescence amplitudes, normalized by the total intensity, give the relative populations of these three states.

References

    1. Mankin A. Nature structural & molecular biology. 2006;13:858–860. - PubMed
    1. Carter AP, Clemons WM, Brodersen DE, Morgan-Warren RJ, Wimberly BT, Ramakrishnan V. Nature. 2000;407:340–8. - PubMed
    1. Wimberly BT, Brodersen DE, Clemons WM, Jr, Morgan-Warren RJ, Carter AP, Vonrhein C, Hartsch T, Ramakrishnan V. Nature. 2000;407:327–39. - PubMed
    1. Schuwirth BS, Borovinskaya MA, Hau CW, Zhang W, Vila-Sanjurjo A, Holton JM, Cate JH. Science (New York, NY. 2005;310:827–34. - PubMed
    1. Korostelev A, Trakhanov S, Laurberg M, Noller HF. Cell. 2006;126:1065–77. - PubMed

Publication types