. 2009 Jan 27;19(2):83-94.
doi: 10.1016/j.cub.2008.12.008. Epub 2009 Jan 15.

Establishing new sites of polarization by microtubules

Affiliations

Establishing new sites of polarization by microtubules

Nicolas Minc et al. Curr Biol. .

Abstract

Background: Microtubules (MTs) participate in the spatial regulation of actin-based processes such as cytokinesis and cell polarization. The fission yeast Schizosaccharomyces pombe is a rod-shaped cell that exhibits polarized cell growth at cell tips. MT plus ends contact and shrink from the cell tips and contribute to polarity regulation.

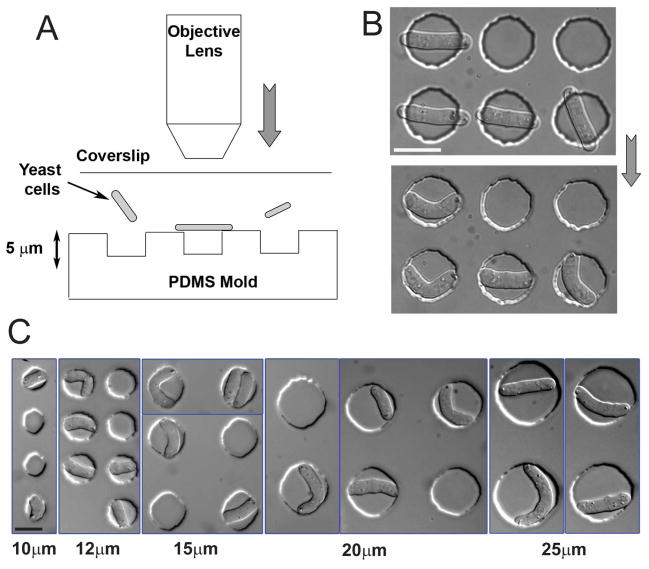
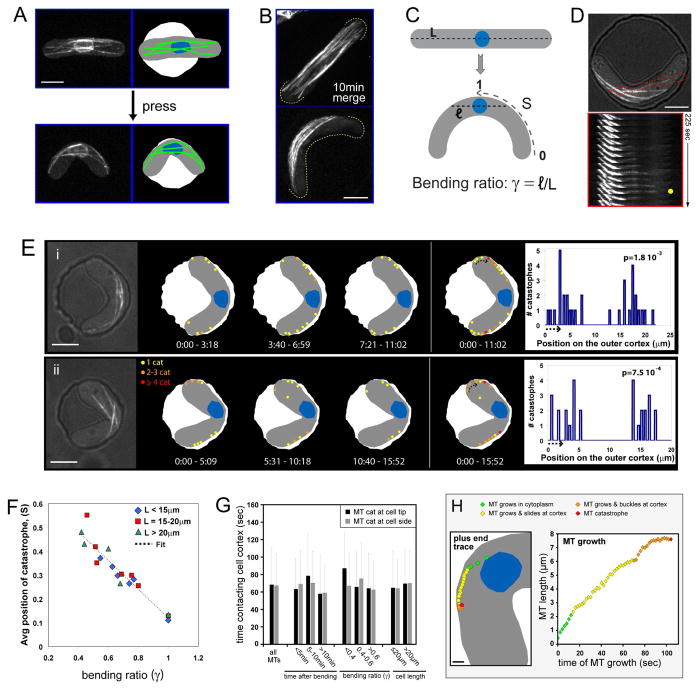
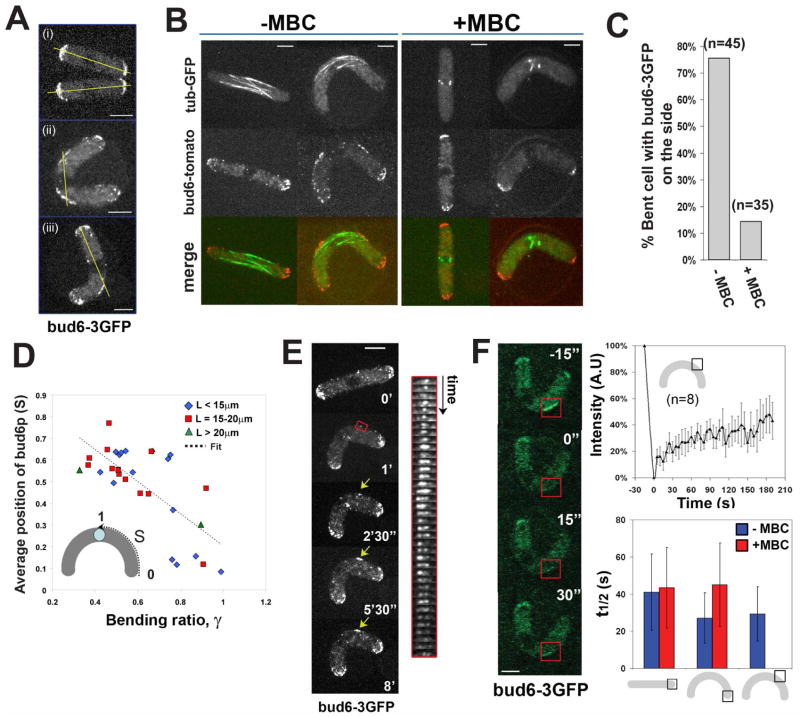
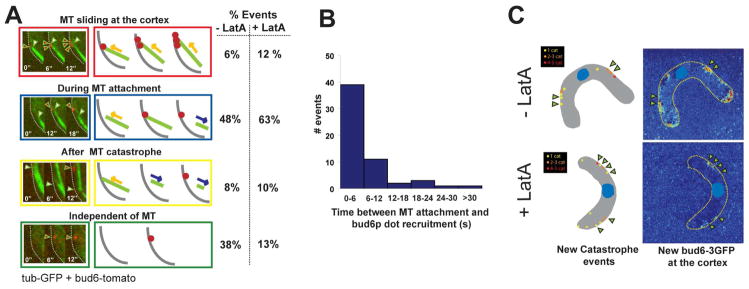
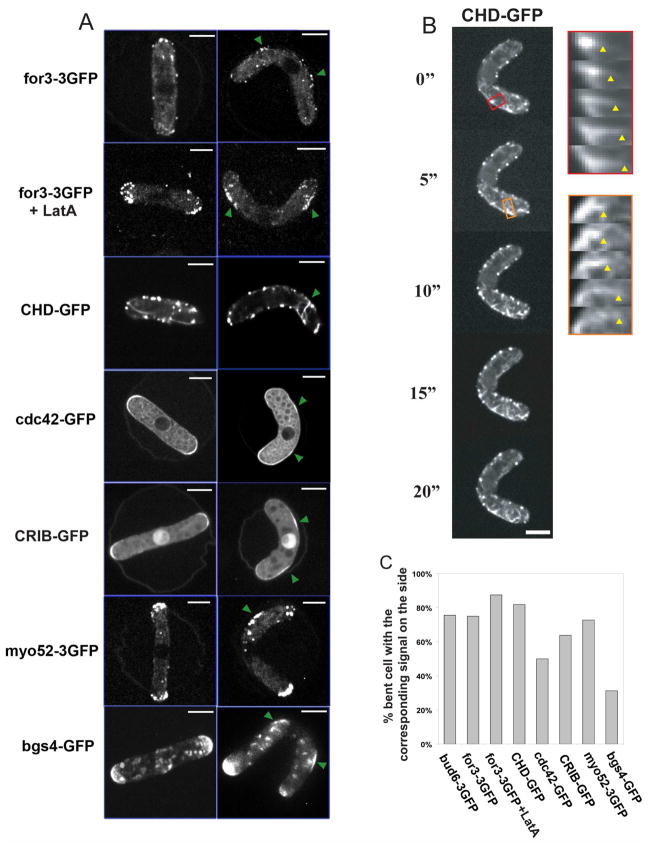
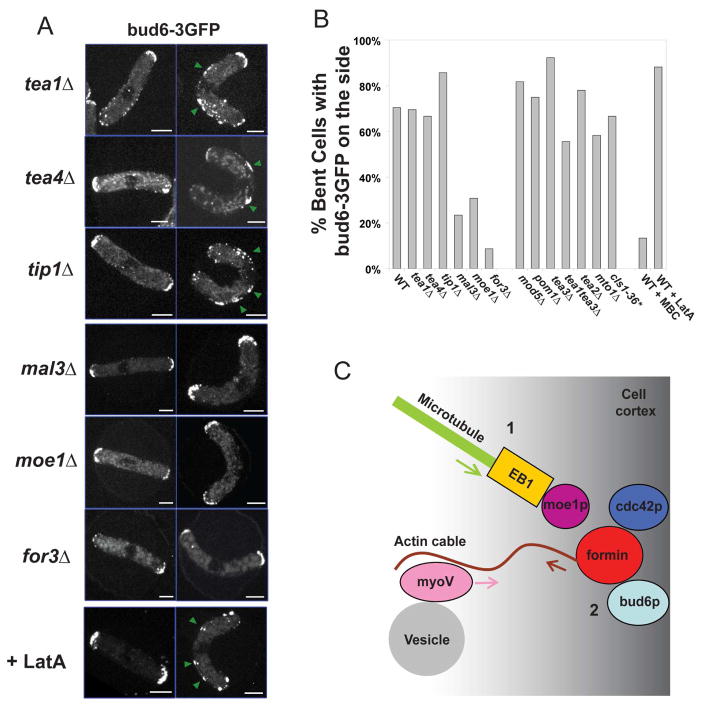
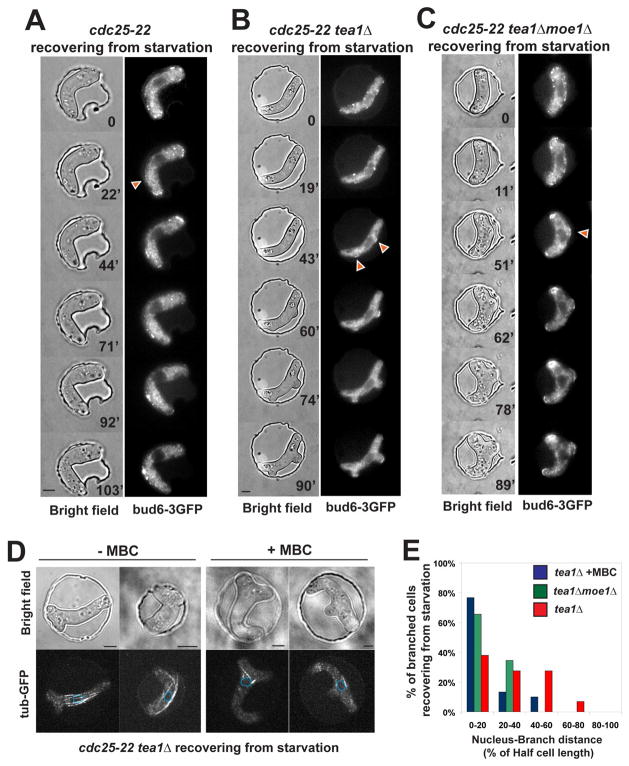
Results: Here, we investigate the effects of changing cell shape on MTs and cell-polarization machinery. We physically bend fission yeast cells by forcing them into microfabricated femtoliter chambers. In these bent cells, MTs maintain a straight axis and contact and shrink from cortical sites at the sides of cells. At these ectopic sites, polarity factors such as bud6p, for3p (formin), and cdc42p are recruited and assemble actin cables in a MT-dependent manner. MT contact at the cortex induces the appearance of a bud6p dot within seconds. The accumulation of polarity factors leads to cell growth at these sites, when the MT-associated polarity factor tea1p is absent. This process is dependent on MTs, mal3p (EB1), moe1p (an EB1-binding protein), and for3p but, surprisingly, is independent of the tea1p-tea4p pathway.

Conclusions: These studies provide a direct demonstration for how MTs induce actin assembly at specific locations on the cell cortex and begin to identify a new pathway involved in this process. MT interactions with the cortex may be regulated by cortical-attachment sites. These findings highlight the crosstalk between cell shape, polarity mechanisms, and MTs responsible for cell morphogenesis.


Figures

Figure 1
Figure 1. Bending fission yeast cells in situ
(A) Schematic illustration of the technique used to bend fission yeast cells in situ: cells in liquid media are placed between a PDMS array of microwells and a glass coverslip. The coverslip is subsequently pressurized by overfocusing the objective of an upright microscope. (B) DIC images of the same fission yeast cells before and after pressurizing with the objective. Strain: FC504 (cdc25-22 at 25°C). (C) DIC images of fission yeast cells of varying sizes bent in holes having different diameters (indicated at the bottom). Strains: FC420, FC504. Scale bars: 10μm.
Figure 2
Figure 2. Effects of bent cell geometry on the dynamic interphase MTs
(A) MT organization in a bent cell. Maximum projection confocal image of a cell expressing GFP-tubulin and cut11-GFP (nuclear pore) prior to and immediately after being pushed into a chamber. In the schematic, MTs are indicated in green and the nucleus in blue. Strain: FC1451 (cdc25-22 at 25°C). (B) MTs associate with the outer curvature of bent cells. Merge of 14 confocal stacks over 10 min from cells expressing GFP-tubulin. Strain: NM11 (cdc25-22 at 25°C). (C) Schematic representing the geometrical parameters for predicting MT sites of contact in a bent cell. L is the cell length, and ℓ is twice the distance from the center of the nucleus to the side of the cell following the former axis of the straight cell in the bent cell. The bending ratio, γ = ℓ/L describes how close the cortex is from the nucleus along the axis perpendicular to the short axis of the cell. S is the absolute coordinate along the outer curvature (S=0 at the tip and S=1 in the middle). (D) MTs undergo catastrophe at the side of bent cells. Top: DIC/GFP-tubulin merge of a bent cell with a single MT boxed in red. Bottom: time-lapse images of the boxed MT, showing MT growth to the side of the cell, catastrophe at the cortex (yellow dot), and shrinkage. Strain: NM11. (E) Schematic of MT catastrophe events in two representative bent cells—one with a centered nucleus (i), and one with an off-centered nucleus (ii). MT catastrophes were determined from time-lapse images of GFP-tubulin. Specific points on the cortex that experience multiple catastrophe events are indicated (orange and red dots) and further represented in the bar plot on the right. Dot size and bar width encompass the error made in detecting the MT + TIP. The arrow in the cell indicates the beginning of the corresponding bar plot. The number p, indicated on the top right of each bar plot represents the probability of having this particular distribution as compared to a Monte-Carlo trial (see supplementary material). p is calculated using a cortical stretch of 16μm for cell (i) and 9μm for cell (ii). Time is in min:sec. Strain: NM11. Scale bars: 5μm. (F) Average position of catastrophes (Scat) in different cells plotted as a function of the bending ratio. The linear fit returns Scat = 0.72 – 0.60γ (See supplementary material also) Strains: FC1234, FC1234 + HU and NM11. (G) Cortical contact times of MTs that undergo catastrophe at the cell tip vs. the cell side. Data represents 276 MTs (136 and 140 for the cell tip and cell side, respectively) from 19 cells. Error bars represent the standard deviations for the cortical times in each condition. Strain: NM11. (H) MTs in wildtype bent cells expressing GFP-tubulin were examined in time-lapse (single-plane, 0.5fps; n=14 MTs) as in Movie 7. Left: schematic indicating the position of a growing MT plus end in a bent cell (4s intervals). Right: entire length of this same MT as a function of time (2s intervals) as it grows to the cortex (12s), slides along the cortex (56s), and buckles (36s) before catastrophe. Strain: NM11. Scale bar: 1μm.
Figure 3
Figure 3. Initial recruitment of the polarity factor bud6p is MT-dependent
(A) Bud6-3GFP localization in (i) straight and (ii and iii) bent fission yeast cells. The yellow line represents the predicted axis of MT growth from the nucleus. Strain: NM01 (cdc25-22 at 25°C). (B) Bud6-tomato and GFP-tubulin in straight and bent cells in the absence and in the presence of 50μM MBC. Strain: NM42 (cdc25-22 at 25°C). (C) Proportion of cells having bud6-3GFP specifically on the side, in the absence and in the presence of 50μM MBC. (D) Average position of the center of the bud6-3GFP band along the cell outer curvature as a function of the bending ratio. The linear fit returns Sbud6 = 0.95 – 0.74γ. (E) Time-lapse images of bud6-3GFP recruitment to the cell side upon bending of the cell (indicated by the yellow arrow). The kymograph follows the region of the cell in the red box, with a time interval of 30s. Strain: NM01. (F) FRAP experiments on bud6-3GFP. Time-lapse imaging of bud6-3GFP on the cell side recovering from photobleaching. Fluorescent intensity of bud6-3GFP on the cell side as a function of time during a FRAP experiments; the plot represents the average of 8 experiments on 8 different cells, and the bars represent the standard deviation for each point. Half-time recovery are shown for FRAP experiments of bud6-3GFP in the depicted configurations, in the absence and in the presence of 50μM MBC (in the presence of MBC bud6-3GFP is not targeted to the cell side). Strain: NM01. Scale bars: 5μm.
Figure 4
Figure 4. Recruitment of bud6p by MT contact
(A) Dynamics of bud6p recruitment upon MT contact. Left: Single focal plane, two-color imaging (6s intervals) of GFP-tubulin and bud6-tomato on the outer curvature of a bent cell. Right: Schematics of the different observed relationships between MT contact and bud6p-dots recruitment. Far right: Proportion of these observed events in the absence (n=52) and in the presence (n=60) of LatA. (Note that in most cases, MT contact led to a bud6p dot recruitment) (B) Histogram representing the time between a MT attachment on the cortex and the appearance of a bud6p dot. Two color single focal planes were used to compute these data, the binning corresponds to the error in the measurement. (C) Colocalization studies of MT catastrophe and new bud6p deposition in bent cells in the absence and in the presence of LatA. Two-color 3D confocal time-lapse images of cells expressing GFP-tubulin and bud6-tomato were acquired for about 10 min with a 30s temporal resolution. MT catastrophe mappings in these cells are depicted on the left side. Bud6-tomato addition is computed by subtracting the first image from the average image of the entire time-lapse and represented using Matlab. Arrowheads indicate bud6p deposition colocalizing with catastrophe sites. Strain: NM42.
Figure 5
Figure 5. Accumulation of polarity factors and actin assembly at ectopic sites in bent cells
(A) Localization of the indicated polarity factor fused to GFPs in straight and bent cells, the green arrows point to the sites of recruitment on the sides of the bent cells. Images are maximum confocal projections except for CHD-GFP and cdc42-GFP which are single focal planes. Strains from top to bottom: NM07, NM33, NM59, NM145 (all cdc25-22 at 25°C); FC1371 + HU and NM15 (cdc25-22 at 25°C). (B) Time-lapse imaging of a bent cell expressing an F-actin marker GFP-CHD. Kymographs show that actin filaments are growing from ectopic sites of the cell. The arrowheads indicate the end of the elongating actin cable. Single-plane confocal images are shown. Strain: NM33. (C) Proportion of wildtype bent cells that show a specific location of the indicated factors to the cell’s outer curvature (n≈30 for each condition). Scale bars: 5μm.
Figure 6
Figure 6. Recruitment of polarity factors by MTs is independent of the tea1-tea4p pathway, but requires mal3p, moe1p, for3p and the secretory pathway
(A) Bud6-3GFP position in normal and bent cell of the indicated mutants, and in cells treated with the indicated chemicals. Strains: NM14, NM34, NM30, NM48, NM117, NM115, NM01 (all cdc25-22 at 25°C). Scale bars: 5μm. (B) Proportion of bent cells that show a specific location of bud6-3GFP to the cell side in the indicated genetic backgrounds and conditions (n≈30 for each condition). Some mutants and the corresponding strain numbers are shown in Figure S9. *For this experiment, the temperature of the objective was raised to 30°C with a Bioptechs objective heater. (C) Proposed model for how MT contact induces sites of cell polarization at the cortex: 1. A MT plus end contacts the cortex and recruits for3p (formin) bud6p and cdc42p. This recruitment is dependent on mal3p (EB1) and moe1 (EB1-binding protein). 2. The formin assembles actin cable structures from these sites. 3. Actin filaments guide the transport of myosin V and its cargo such as vesicles towards these ectopic sites.
Figure 7
Figure 7. MTs position ectopic branching in tea1Δ cells in a moe1p dependent manner
(A) cdc25-22 cell in a wildtype background (at 25°C) expressing bud6-3GFP recovers from starvation in a bent conformation in a chamber. The cell grows at the tips while bud6p is ectopically recruited (arrowhead). Strain: NM01. (B) cdc25-22 tea1Δ cell (at 25°C) expressing bud6-3GFP recovers from starvation in a bent conformation in a chamber. The cell grows at the ectopic sites where bud6p was recruited (arrowheads). Strain: NM14. (C) cdc25-22 tea1Δ moe1Δ cell (at 25°C) expressing bud6-3GFP recovers from starvation in a bent conformation in a chamber. Strain: NM151. (D) cdc25-22 cells in a tea1Δ background (at 25°C) expressing GFP-tubulin upon recovery from starvation in a bent conformation imposed by the chamber ±MBC. The nuclear position is indicated by the blue dotted lines. Strain: NM20. (E) Effect of MBC and moe1p on the absolute distance from the nucleus to the branching sites in cdc25-22 tea1Δ cells recovering from starvation in a bent conformation in a chamber. Strain: NM20. Scale Bars = 5μm.

Comment in

Similar articles

Cited by

References

    1. Siegrist SE, Doe CQ. Microtubule-induced cortical cell polarity. Genes Dev. 2007;21:483–496. - PubMed
    1. Wen Y, Eng CH, Schmoranzer J, Cabrera-Poch N, Morris EJ, Chen M, Wallar BJ, Alberts AS, Gundersen GG. EB1 and APC bind to mDia to stabilize microtubules downstream of Rho and promote cell migration. Nat Cell Biol. 2004;6:820–830. - PubMed
    1. Martin SG, Chang F. New end take off: regulating cell polarity during the fission yeast cell cycle. Cell Cycle. 2005;4:1046–1049. - PubMed
    1. Brunner D, Nurse P. CLIP170-like tip1p spatially organizes microtubular dynamics in fission yeast. Cell. 2000;102:695–704. - PubMed
    1. Chang F, Peter M. Yeasts make their mark. Nat Cell Biol. 2003;5:294–299. - PubMed

Publication types

MeSH terms