. 2009 Mar 27;284(13):8797-811.
doi: 10.1074/jbc.M805897200. Epub 2009 Jan 15.

S100B Protein Regulates Astrocyte Shape and Migration via Interaction with Src Kinase: IMPLICATIONS FOR ASTROCYTE DEVELOPMENT, ACTIVATION, AND TUMOR GROWTH

Affiliations

S100B Protein Regulates Astrocyte Shape and Migration via Interaction with Src Kinase: IMPLICATIONS FOR ASTROCYTE DEVELOPMENT, ACTIVATION, AND TUMOR GROWTH

Flora Brozzi et al. J Biol Chem. .

Abstract

S100B is a Ca(2+)-binding protein of the EF-hand type that is abundantly expressed in astrocytes and has been implicated in the regulation of several intracellular activities, including proliferation and differentiation. We show here that reducing S100B levels in the astrocytoma cell line GL15 and the Müller cell line MIO-M1 by small interference RNA technique results in a rapid disassembly of stress fibers, collapse of F-actin onto the plasma membrane and reduced migration, and acquisition of a stellate shape. Also, S100B-silenced GL15 and MIO-M1 Müller cells show a higher abundance of glial fibrillary acidic protein filaments, which mark differentiated astrocytes, compared with control cells. These effects are dependent on reduced activation of the phosphatidylinositol 3-kinase (PI3K) downstream effectors, Akt and RhoA, and consequently elevated activity of GSK3beta and Rac1 and decreased activity of the RhoA-associated kinase. Also, rat primary astrocytes transiently down-regulate S100B expression when exposed to the differentiating agent dibutyryl cyclic AMP and re-express S100B at later stages of dibutyryl cyclic AMP-induced differentiation. Moreover, reducing S100B levels results in a remarkably slow resumption of S100B expression, suggesting the S100B might regulate its own expression. Finally, we show that S100B interacts with Src kinase, thereby stimulating the PI3K/Akt and PI3K/RhoA pathways. These results suggest that S100B might contribute to reduce the differentiation potential of cells of the astrocytic lineage and participate in the astrocyte activation process in the case of brain insult and in invasive properties of glioma cells.


Figures
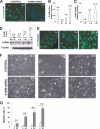
FIGURE 1.
FIGURE 1.
Silencing of S100B in GL15 cells results in stellation. A, control and S100B siRNA-treated cells at post-transfection day 2 were immunostained with an anti-S100B antibody (green) and counterstained with DAPI (blue). Shown are merged images only. B, quantitative PCR demonstrating the relative expression of S100B mRNA in S100B siRNA-treated cells (si) at different time points after transfection, relative to control cells (c) at the end of the transfection period (0 time) (n = 3). C, quantitative PCR demonstrating the relative expression of S100B mRNA in control and S100B siRNA-treated cells at different time points after transfection (n = 3). D, Western blot analysis of S100B in control and S100B siRNA-treated cells at different time points after transfection. Notice the time-dependent accumulation of S100B in control cells and the slow and incomplete recovery of S100B protein expression in S100B siRNA-treated cells (n = 3). E, control cells were immunostained with an anti-S100B antibody and counterstained with DAPI at different time points after transfection. Shown are merged images only. Note the increase in fluorescence signal as a function of cultivation time. F and G, S100B siRNA-treated cells show stellation (F), the incidence of which increases as a function of cultivation time (n = 3) (G), as investigated by phase-contrast microscopy. Bars, 50 μm (A, E, and F).
FIGURE 2.
FIGURE 2.
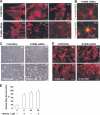
Silencing of S100B in GL15 cells results in stress fiber disassembly and reorganization of F-actin. A, rhodamine-phalloidin staining (red) of control and S100B siRNA-treated cells at different time points after transfection. The cells were counterstained with DAPI (blue). Shown are merged images only. Note the reduction of stress fibers at post-transfection day 2 and the time-dependent increase in cell branching as a function of cultivation time in S100B siRNA-treated cells. B, S100B siRNA-treated cells at post-transfection days 5 and 12 were subjected to rhodamine-phalloidin staining (red) and immunostained with an anti-S100B antibody (green). Shown are merged images only. A faint S100B immunofluorescence signal is found in a perinuclear position at day 5, whereas S100B is additionally found in cell extensions at day 12, in coincidence with the formation of F-actin bundles therein. C and D, effects of S100B silencing on stellation and stress fiber disassembly at post-transfection day 2 are synergistic to those exerted by the ROCK inhibitor, Y27632, as investigated by phase-contrast microscopy (C) and rhodamine-phalloidin staining (D). E, shown are the numbers of stress fiber-devoid cells in control and S100B-silenced cells in the absence or presence of treatment with Y27632 at post-transfection day 2 (n = 3). Bars, 50 μm (A-D). si, S100B siRNA-treated cells; c, control cells.
FIGURE 3.
FIGURE 3.
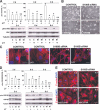
Silencing of S100B in GL15 cells results in reduced phosphorylation of Akt and GSK3β. A, analysis of levels of phosphorylated Akt in control (c) and S100B siRNA-treated (si) cells in the absence or presence the PI3K inhibitor LY294002 (LY) (10 μm) at post-transfection days 2, 6, and 8 (n = 3). B, effects of S100B silencing on stellation at post-transfection day 6 are synergistic to those exerted by the PI3K inhibitor LY294002, as investigated by phase-contrast microscopy. C, treatment of S100B siRNA-treated cells with the GSK3β inhibitor LiCl (2 mm) at post-transfection day 4 results in reduced stellation, as investigated by rhodamine-phalloidin staining. Shown are merged images of rhodamine-phalloidin fluorescence signal (red) and DAPI (blue). D, analysis of levels of phosphorylated GSK3β in control (c) and S100B siRNA-treated (si) cells in the absence or presence of the PI3K inhibitor LY294002 (10 μm) at post-transfection days 2, 6, and 8 (n = 3). E, treatment of S100B siRNA-treated cells for 24 h with the Rac1 inhibitor NSC23766 (50 μm) at post-transfection day 8 results in reduced stellation, as investigated by rhodamine-phalloidin staining. Shown are merged images of rhodamine-phalloidin fluorescence signal (red) and DAPI (blue). Bars, 50 μm (B, C, and E). *, significantly different from control (first column from left in left and right panels)(A and D). **, significantly different from the respective control (S100B siRNA-treated cells in the absence of kinase inhibitors).
FIGURE 4.
FIGURE 4.
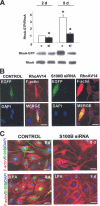
Silencing of S100B in GL15 cells results in reduced RhoA activity. A, control (c) and S100B siRNA-treated (si) cells were subjected to a pull-down assay to detect activated RhoA. *, significantly different from control at post-transfection day 2 (n = 3). B, control and S100B siRNA-treated GL15 cells (post-transfection day 2) were transiently transfected with RhoAV14-green fluorescent protein (EGFP) and treated with rhodamine-phalloidin (red signal) to detect F-actin. Transfected cells were recognized by GFP fluorescence (green signal). Note that cells that have incorporated RhoAV14 are elongated and exhibit a great abundance of stress fibers. C, S100B siRNA-treated cells were incubated with LPA (10 μm, 3 h) at post-transfection day 8 and subjected to rhodamine-phalloidin staining (red) and immunostained with an anti-S100B antibody (green). Cells were counterstained with DAPI (blue). Shown are merged images only. Treatment with LPA results in reformation of stress fibers and reversal of stellation in S100B-silenced cells. Bars, 50 μm (B).
FIGURE 5.
FIGURE 5.
S100B interacts with and activates Src in GL15 cells. A, cell lysates were subjected to immunoprecipitation using a polyclonal anti-S100B antibody, and the immunoprecipitate was probed with a polyclonal anti-Src antibody (top) or a polyclonal anti-S100B antibody (middle). Src (top) and S100B (middle) were detected in the cell lysate (Input), the fraction of cell lysate that did not bind to the anti-S100B antibody (Unbound), the S100B immunoprecipitate (IP αS100B), and the fraction of cell lysate that did not bind to nonimmune IgG (unbound (IgG)). Also shown are the IgG heavy chain (IgG HC; top) and S100B marker (last lane from the right in the middle panel). Cell lysates were subjected to immunoprecipitation using a polyclonal anti-Src antibody, and the immunoprecipitate was probed with a polyclonal anti-S100B antibody (bottom). S100B was detected in the cell lysate (Input), the fraction of cell lysate that did not bind to the anti-Src antibody (Unbound), the Src immunoprecipitate (IP αSrc), and the fraction of cell lysate that did not bind to non-immune IgG (unbound (IgG)). Also shown is the S100B marker (last lane on the right). B, GL15 cells were treated with either vehicle (left) or 20 μm PP2 (right) for 6 h. The cells were analyzed by phase-contrast microscopy (top row) or subjected to rhodamine-phalloidin staining (red)(bottom row). Cells were counterstained with DAPI (blue) (bottom row). Inhibition of Src results in stellation and disassembly of stress fibers. C, conditions were as in D except that the cells were treated for 1 or 3 h with increasing doses of PP2 and analyzed for Akt phosphorylation levels relative to total Akt levels by Western blotting. Inhibition of Src results in reduced phosphorylation levels of Akt. D, control and S100B siRNA-treated GL15 cells at post-transfection day 1 were subjected to Western blotting using a polyclonal anti-phosphorylated (Tyr527) Src. Note the enhanced phosphorylation levels of Src in S100B-silenced cells compared with control cells, indicative of reduced Src kinase activation status in the absence of S100B.
FIGURE 6.
FIGURE 6.
Silencing S100B in GL15 cells results in reduced migration and proliferation. A, migration assay in Boyden chambers. Shown is migration of control (c) and S100B siRNA-treated (si) cells at 24 h post-transfection (left panel) and of control and S100B siRNA-treated cells at 6 h post-transfection in the absence or presence of 1 μm Y27632 (right). B and C, wound healing assay. Monolayers of control and S100B siRNA-treated cells were scratched at post-transfection day 1 and examined by phase-contrast microscopy at time intervals (C). Shown in B is a quantitative analysis of wound width in experiments in C (n = 3). D, fluorescence-activated cell sorting analysis of control (c) and S100B siRNA-treated (si) cells at post-transfection days 1 and 5. E, Western blot analysis of cyclin D1 in control (c) and S100B siRNA-treated (si) cells at the end of the transfection procedure (0 d) and at post-transfection day 1. *, significantly different from control (left column in upper and lower panels in A and left column in each pair in D and E)(n = 3). **, significantly different from all other samples (n = 3). Bars, 50 μm (C).
FIGURE 7.
FIGURE 7.
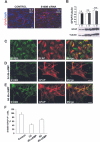
Silencing of S100B in GL15 cells results in enhanced GFAP filament formation. A, control and S100B siRNA-treated cells were analyzed for expression of GFAP intermediate filaments by immunofluorescence (red) at post-transfection day 12. Cells were counterstained with DAPI (blue). Shown are merged images only. Notice the greater (∼61%) percentage of GFAP filament signal in S100B siRNA-treated cells compared with control (∼13%) cells. B, Western blotting of GFAP control (c) and S100B siRNA-treated (si) cells at post-transfection days 1, 6, and 12 (n = 3). C-E, reduced expression of S100B in differentiating primary astrocytes and re-expression of S100B in differentiated astrocytes. Astrocytes were isolated from 2-day-old rat pups and cultivated in 10% FBS. After isolation and/or following treatment with Bt2cAMP (see below), the cells were fixed and subjected to double immunofluorescence with a monoclonal anti-S100B antibody (green) and a polyclonal anti-GFAP antibody (red). The cells were counterstained with DAPI (blue). C, double immunofluorescence image of astrocytes at day 15 after plating (i.e. 3 days after shaking of cultures to eliminate nonastrocytic cells). The majority of cells are polygonal in shape and S100B-positive/GFAP filament-positive. D, astrocytes at day 15 after plating were treated with 1 nm Bt2cAMP for 3 days and subjected to double immunofluorescence as above. A relatively high percentage of cells are ramified and S100B-negative/GFAP filament-positive, whereas a minor fraction are S100B-positive/GFAP filament-negative. Thus, shape changes in differentiating astrocytes (i.e. stellation) are accompanied by reduced expression of S100B. E, astrocytes at day 15 after plating were treated with 1 mm Bt2cAMP for 6 days and subjected to double immunofluorescence as above. The majority of cells are ramified and S100B-positive/GFAP filament-positive. Thus, with increasing differentiation time, S100B becomes re-expressed in stellate astrocytes. F, quantitative analysis of S100B-positive/GFAP filament-positive cells in experiments in C-E (n = 3). Bars, 50 μm (A and C-E).
FIGURE 8.
FIGURE 8.
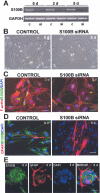
Silencing S100B in MIO-M1 Müller cells results in stellation, stress fiber disassembly, and enhanced GFAP filament formation. A, control (c) and S100B siRNA-treated (si) cells were analyzed by RT-PCR at the end of the transfection procedure (0 d) and 2 and 5 days post-transfection using S100B-specific oligonucleotides. B, control and S100B siRNA-treated cells were cultivated for 5 days and analyzed by phase-contrast microscopy. Transfection with S100B siRNA results in stellation. C, control and S100B siRNA-treated cells were cultivated for 2 days and subjected to rhodamine-phalloidin staining (red) and immunostained with an anti-S100B antibody (green). Cells were counterstained with DAPI (blue). Shown are merged images only. At post-transfection day 2, S100B silenced cells show reduced stress fibers compared with control cells. D, control and S100B siRNA-treated cells were immunostained using an anti-GFAP antibody (red) and an anti-S100B antibody (green) and counterstained with DAPI (blue). Merged images only are presented. E, MIO-M1 cells were cultivated in serum-free medium for 14 days and immunostained using an anti-GFAP antibody (red) and an anti-S100B antibody (green) and counterstained with DAPI (blue). Shown are a neurosphere-like structure and neighboring, sparse cells. Bars, 50 μm (B-E). GAPDH, glyceraldehyde-3-phosphate dehydrogenase.
FIGURE 9.
FIGURE 9.
Schematic representation of putative S100B effects on RhoA/ROCK and GSK3β-Rac1 via Src/PI3K in cultured astrocytes. S100B stimulates PI3K via interaction with and activation of Src kinase thereby activating RhoA/ROCK and favoring stress fiber formation and migration. S100B-activated Src/PI3K also stimulates Akt, which, in turn, inactivates GSK3β with resultant reduced activity of Rac1. Inhibition of S100B expression results in reduced RhoA/ROCK activity and high GSK3β-Rac1 activity with resultant reduced stress fiber formation, reduced migration, and formation of cell extensions (stellation).

Similar articles

Cited by

References

    1. Donato, R. (2001) Int. J. Biochem. Cell Biol. 33 637-668 - PubMed
    1. Heizmann, C. W., Fritz, G., and Schaefer, B. W. (2002) Front. Biosci. 7 1356-1368 - PubMed
    1. Marenholz, I., Heizmann, C. W., and Fritz, G. (2004) Biochem. Biophys. Res. Commun. 322 1111-1122 - PubMed
    1. Markowitz, J., MacKerell, A. D., Jr., and Weber, D. J. (2007) Mini Rev. Med. Chem. 7 609-616 - PubMed
    1. Rustandi, R. R., Baldisseri, D. M., and Weber, D. J. (2000) Nat. Struct. Biol. 7 570-574 - PubMed

Publication types

MeSH terms

LinkOut - more resources