. 2009 Jan 15;69(2):565-72.
doi: 10.1158/0008-5472.CAN-08-3389.

Basal subtype and MAPK/ERK kinase (MEK)-phosphoinositide 3-kinase feedback signaling determine susceptibility of breast cancer cells to MEK inhibition

Affiliations

Basal subtype and MAPK/ERK kinase (MEK)-phosphoinositide 3-kinase feedback signaling determine susceptibility of breast cancer cells to MEK inhibition

Olga K Mirzoeva et al. Cancer Res. .

Abstract

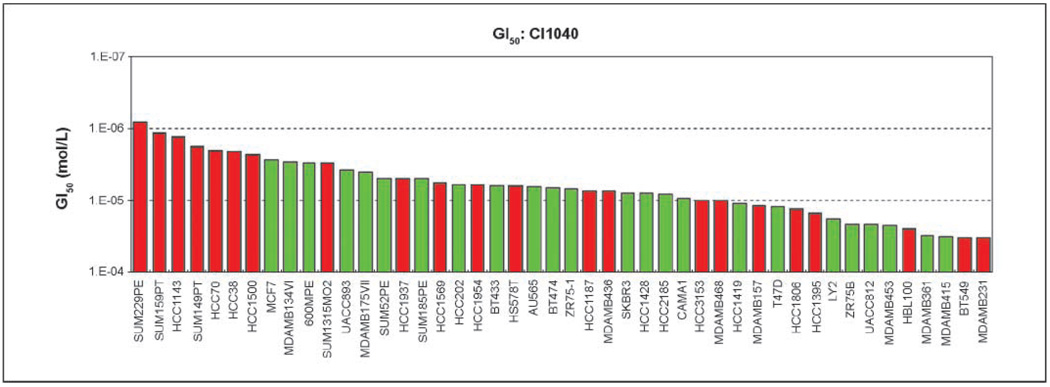
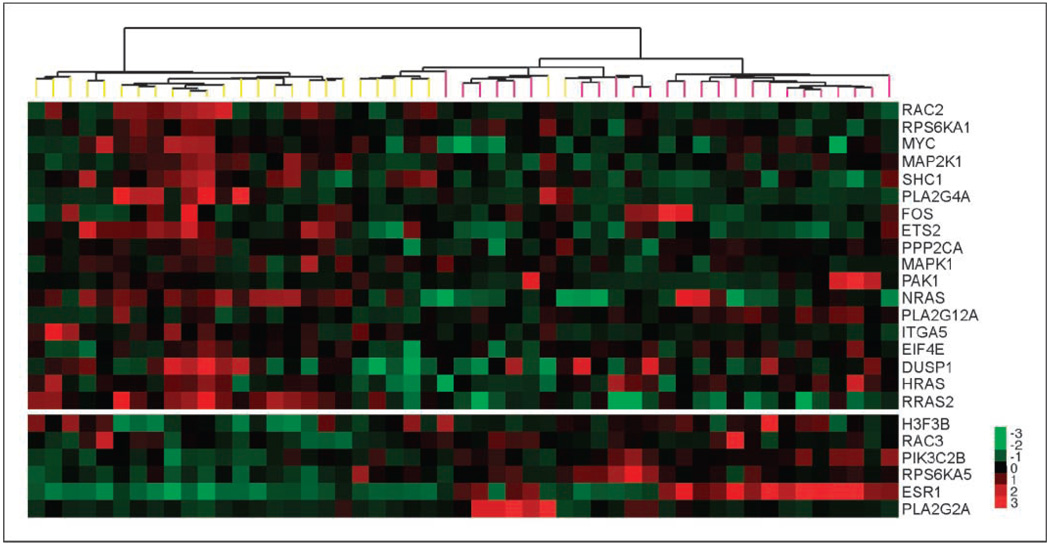
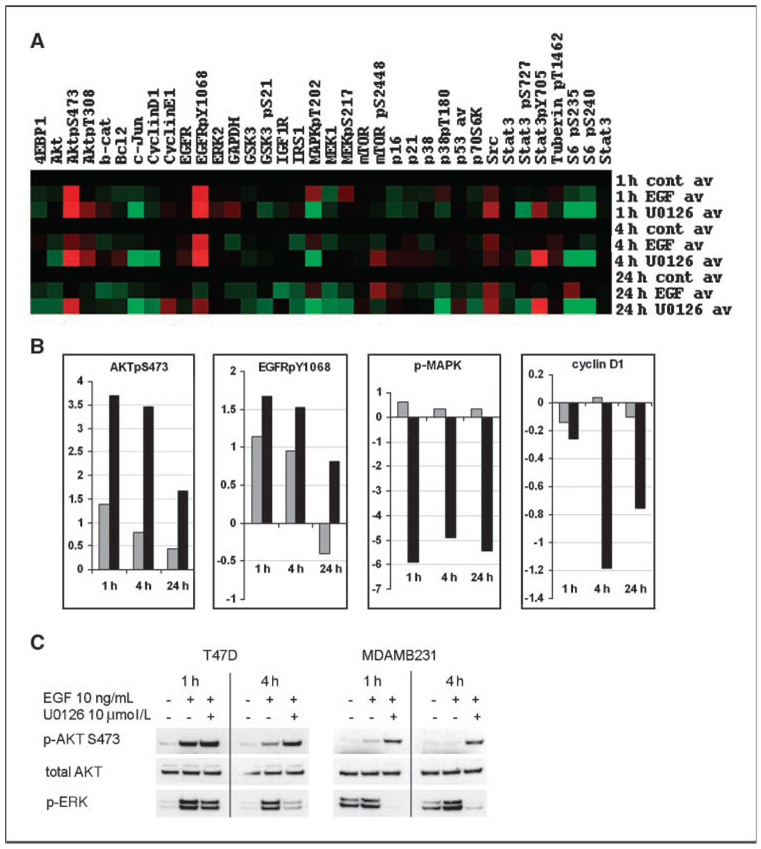
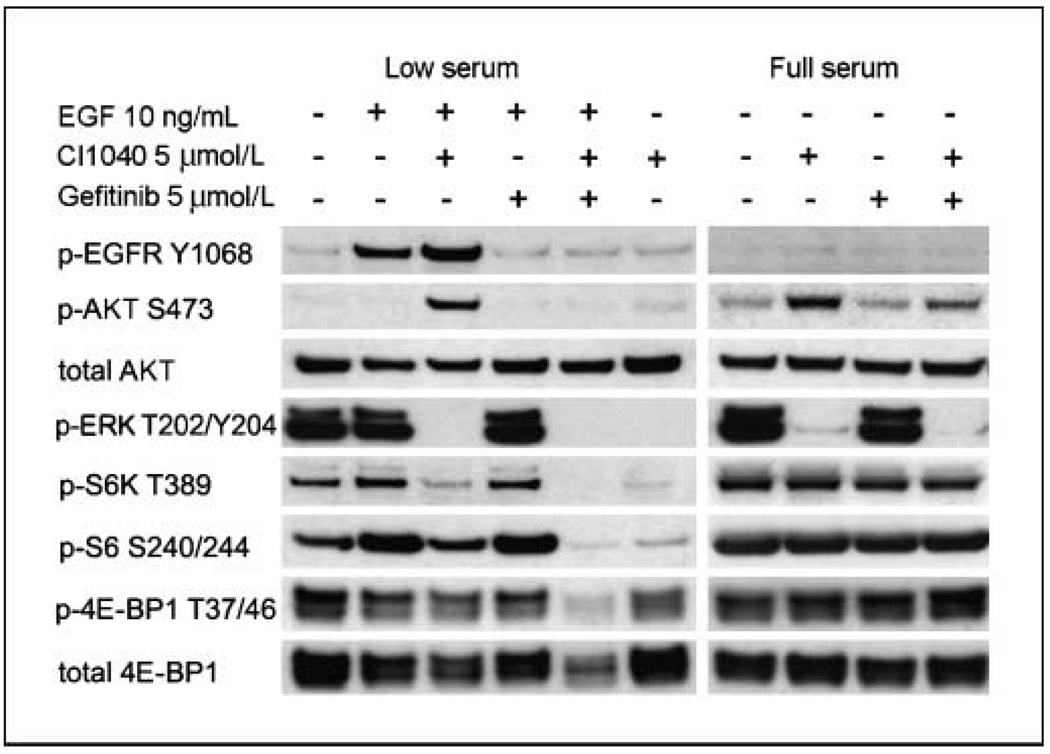
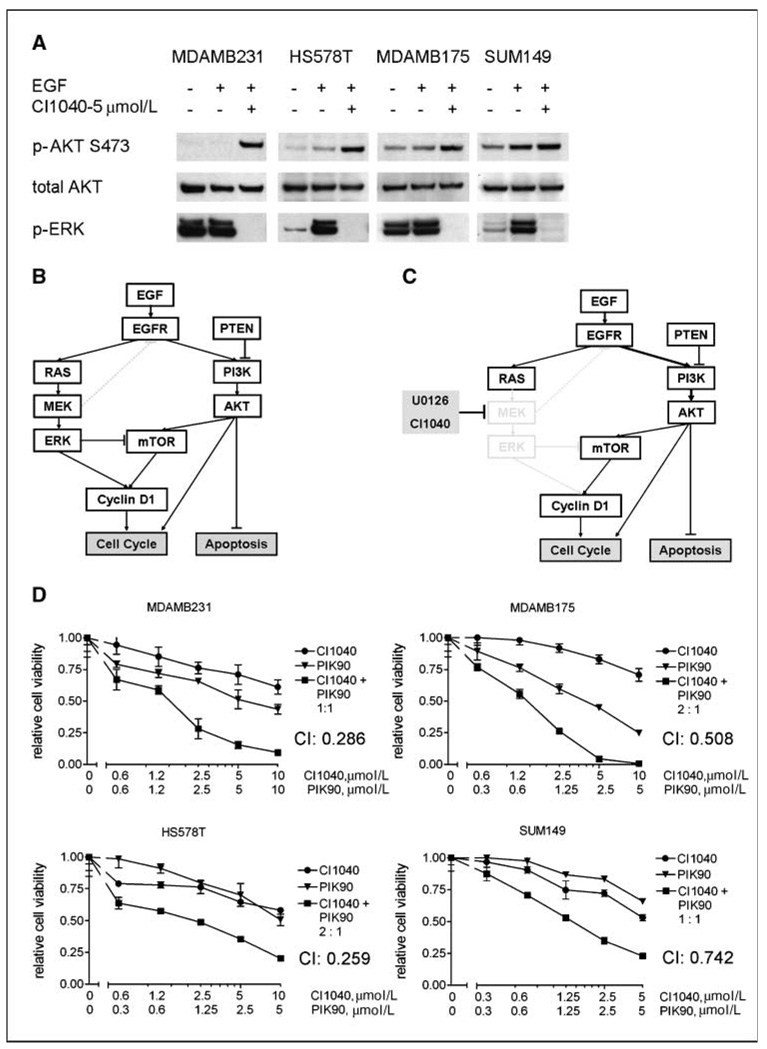
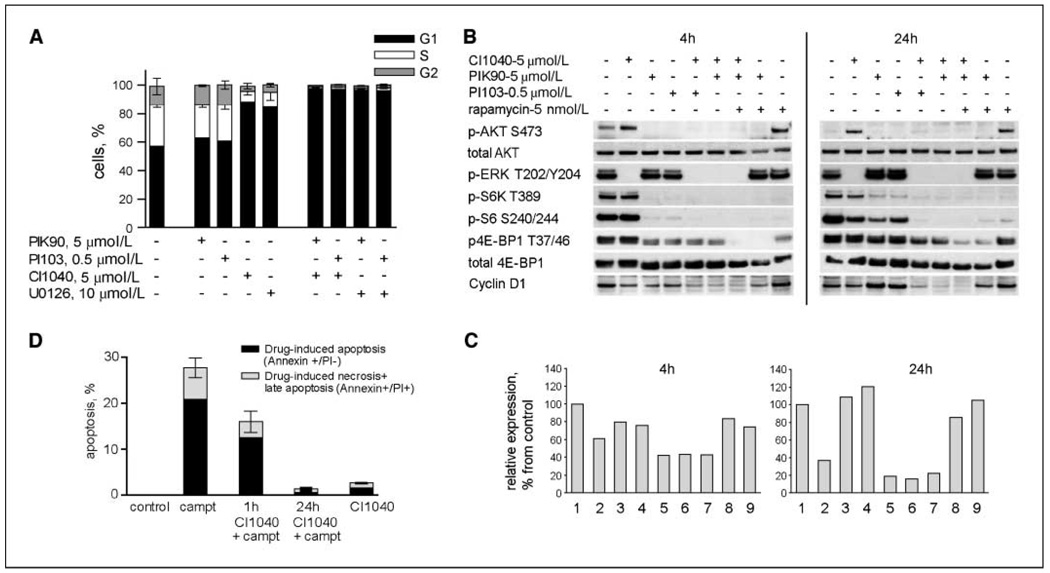
Specific inhibitors of mitogen-activated protein kinase/extracellular signal-regulated kinase (ERK) kinase (MEK) have been developed that efficiently inhibit the oncogenic RAF-MEK-ERK pathway. We used a systems-based approach to identify breast cancer subtypes particularly susceptible to MEK inhibitors and to understand molecular mechanisms conferring resistance to such compounds. Basal-type breast cancer cells were found to be particularly susceptible to growth inhibition by small-molecule MEK inhibitors. Activation of the phosphatidylinositol 3-kinase (PI3K) pathway in response to MEK inhibition through a negative MEK-epidermal growth factor receptor-PI3K feedback loop was found to limit efficacy. Interruption of this feedback mechanism by targeting MEK and PI3K produced synergistic effects, including induction of apoptosis and, in some cell lines, cell cycle arrest and protection from apoptosis induced by proapoptotic agents. These findings enhance our understanding of the interconnectivity of oncogenic signal transduction circuits and have implications for the design of future clinical trials of MEK inhibitors in breast cancer by guiding patient selection and suggesting rational combination therapies.


Conflict of interest statement

Disclosure of Potential Conflicts of Interest

No potential conflicts of interest were disclosed.

Figures

Figure 1
Figure 1
Comparison of sensitivity of breast cancer cell lines to MEK inhibitor CI1040. Forty-six basal or luminal breast cancer cell lines were treated with increasing doses of CI1040 and cell viability was assessed at 0 h (time of drug addition) and at 72 h after treatment. GI50 was calculated from the dose-response curves as described in Materials and Methods. Data are presented as GI50 (mol/L) of cell lines in the order of most sensitive to most resistant (from left to right). Red and green columns, basal and luminal cellular phenotype, respectively. All data for GI50, TGI, and LC50 for CI1040 and U0126 response of cell lines are summarized in Supplementary Table S1.
Figure 2
Figure 2
Breast cancer cell lines can be hierarchically clustered according to their expression of the MAPK-related gene predictors. Each row represents the relative transcript abundance (in log2 space) for one gene; each column represents data from one cell line. Expression of genes in the top panel predicts sensitivity to MEK inhibitors, whereas expression of those in the bottom panel predicts resistance. Within each panel, genes are ordered by q value. In the top panel, the most significant predictors are at the top; in the bottom panel, the most significant predictors are at the bottom. In the tree, yellow end nodes denote basal cell lines and pink end nodes denote luminal cell lines.
Figure 3
Figure 3
Proteomic analysis of MEK inhibition in breast cancer cells. A, heat map of protein and phosphoprotein expression profiles. MDAMB231 cells were treated with MEK inhibitor U0126 (10 µmol/L) as described in Materials and Methods, and 30 min later, they were stimulated with EGF (10 ng/mL). The protein lysates were collected at 1, 4, and 24 h after EGF addition and analyzed by RPPA. Values are expressed as log2 fold difference from control (untreated) samples at each time point. B, relative expression changes of AKTpS473, EGFRpY1068, phosphorylated MAPK (p-MAPK), and Cyclin D1 as detected by RPPA. Gray columns, EGF treatment; black columns, EGF + U0126 treatment. Control = 0. Values for phosphoproteins were normalized by corresponding total protein levels. C, conventional Western blot analysis of p-AKT and p-ERK (p-MAPK) expression in response to U0126 treatment in T47D and MDAMB231 cell lines. Cells were treated with MEK inhibitor in the same conditions as for RPPA experiment and the protein lysates were collected at 1 and 4 h after EGF stimulation.
Figure 4
Figure 4
Western blot analysis of the biochemical response of MDAMB231 cells treated with MEK inhibitor CI1040, EGFR inhibitor gefitinib, or their combination in low (0.1% FBS) and full (10% FBS) serum conditions. Cells were harvested at 4 h after drug treatment. In low serum conditions and in the presence of EGF, MEK inhibition results in strong phosphorylated EGFR (p-EGFR) and p-AKT up-regulation, which is abrogated by EGFR inhibitor.
Figure 5
Figure 5
Synergistic response of breast cancer cell lines to a combination of MEK and PI3K inhibitors correlates with their up-regulated p-AKT status induced by MEK inhibition. A, Western blot analysis of p-AKT and p-ERK expression in response to CI1040 treatment in four breast cancer cell lines: MDAMB231, MDAMB175, HS578T, and SUM149. The cells were treated with MEK inhibitor in low serum conditions, and in 30 min, they were stimulated with EGF and the protein lysates were collected at 4 h after EGF. B and C, schematic summary of the RAS-RAF-MEK-ERK and PI3K pathway interconnectivity in the absence (B) and presence (C) of MEK inhibitors. D, synergistic effect of combination of MEK and PI3K inhibitors on cell viability of cell lines displaying MEK inhibitor–induced AKT phosphorylation. Dose/effect curves for single inhibitors CI1040 and PIK90 and their combinations at fixed molar ratio are presented. Cell viability was measured at 72 h after treatment with the drugs using ATP-based cell viability assay (Promega). Relative cell viability of drug-treated cells was calculated as a fraction of control. Points, mean of triplicates; bars, SD. CIs at 50% dose response are calculated using CalcuSyn software.
Figure 6
Figure 6
Biological effects of MEK inhibitors in combination with PI3K inhibitors and camptothecin. A, FACS-based analysis was used to determine percentage of MDAMB231 cells in G1, S, and G2 phases of the cell cycle at 72 h after treatment with the single drugs and with their combinations at indicated doses. Whereas PI3K inhibitors PIK90 and PI103 do not affect cell cycle distribution, their addition to MEK inhibitors CI1040 or U0126 results in complete G1 arrest. Columns, mean of duplicates; bars, SD. For each duplicate, 40,000 cells were acquired. The result was confirmed in two independent experiments. B, Representative Western blot analysis of MDAMB231 cells treated with the indicated drugs and their combinations for 4 or 24 h. The cells were treated with drugs in full serum conditions and harvested at 4 and 24 h after drug addition for protein and RNA isolation. C, cyclin D1 gene expression changes induced by the same drug treatments as in panel B: 1, control; 2, CI1040 (5 µmol/L); 3, PIK90 (5 µmol/L); 4, PI103 (0.5 µmol/L); 5, CI1040 + PI103; 6, CI1040 + PIK90; 7, CI1040 + PIK90 + rapamycin; 8, PIK90 + rapamycin; 9, rapamycin (5 nmol/L). Gene expression was analyzed by Taqman assay; the results are averaged from duplicates. Relative cyclin D1 expression is presented as the percentage of that of control (untreated) cells. D, G1 arrest induced by MEK inhibition rescues the cells from apoptosis induced by cytotoxic agent. MDAMB231 cells were treated with camptothecin (2.5 µmol/L) for 48 h, which resulted in 20% of apoptotic cells. Pretreatment of cells with CI1040 for 1 h reduced the amount of apoptotic cells, whereas pretreatment of cells for 24 h completely eliminated apoptosis induced by camptothecin. Columns, mean of duplicates; bars, SD. For each duplicate, 40,000 cells were acquired. The results were confirmed in two independent experiments.

References

    1. Saal LH, Holm K, Maurer M, et al. PIK3CA mutations correlate with hormone receptors, node metastasis, and ERBB2, and are mutually exclusive with PTEN loss in human breast carcinoma. Cancer Res. 2005;65:2554–2559. - PubMed
    1. Perez-Tenorio G, Alkhori L, Olsson B, et al. PIK3CA mutations and PTEN loss correlate with similar prognostic factors and are not mutually exclusive in breast cancer. Clin Cancer Res. 2007;13:3577–3584. - PubMed
    1. Berns K, Horlings HM, Hennessy BT, et al. A functional genetic approach identifies the PI3K pathway as a major determinant of trastuzumab resistance in breast cancer. Cancer Cell. 2007;12:395–402. - PubMed
    1. Rochlitz CF, Scott GK, Dodson JM, et al. Incidence of activating ras oncogene mutations associated with primary and metastatic human breast cancer. Cancer Res. 1989;49:357–360. - PubMed
    1. Brugge J, Hung MC, Mills GB. A new mutational AKTivation in the PI3K pathway. Cancer Cell. 2007;12:104–107. - PubMed

Publication types

MeSH terms