

doi: 10.1093/bioinformatics/btp029.
Epub 2009 Jan 15.
PROMOT: modular modeling for systems biology
Affiliations
- PMID: 19147665
- PMCID: PMC2647835
- DOI: 10.1093/bioinformatics/btp029
Item in Clipboard
PROMOT: modular modeling for systems biology
Bioinformatics.
.
Abstract
Summary: The modeling tool PROMOT facilitates the efficient and comprehensible setup and editing of modular models coupled with customizable visual representations. Since its last major publication in 2003, PROMOT has gained new functionality in particular support of logical models, efficient editing, visual exploration, model validation and support for SBML.
Availability: PROMOT is an open source project and freely available at http://www.mpi-magdeburg.mpg.de/projects/promot/.
Figures
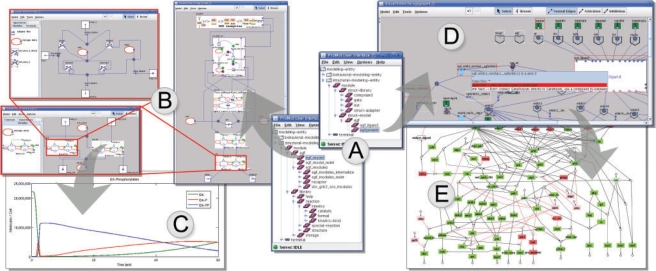
GUI components of Pro Mo T and associated modeling steps for two different modeling types—the dynamic model of the Epidermal Growth Factor Receptor (EGFR) by Saez-Rodriguez et al. (2005) (left) and the logical, signaling EGFR model taken from Samaga et al. (2009) The logic of EGFR/ErbB signaling: theoretical properties and analysis of high-throughput data, submitted (right). Arrows indicate a feasible sequence of modeling steps. The Pro Mo T Browser shows loaded modeling entities (A). Models can be edited using the Pro Mo T Visual Editor (B, D). While editing a background syntax checking marks structural modeling errors (D). Models can be exported to different simulation environments (C) or analysis tools. Subsequently the analysis results from CELL NET ANALYZER can be visualized on top of the network structure (E).
References
-
- Bettenbrock K, et al. A quantitative approach to catabolite repression in Escherichia coli. J. Biol. Chem. 2006;281:2578–2584. - PubMed
-
- Funahashi A, et al. CellDesigner 3.5: a versatile modeling tool for biochemical networks. Proc. IEEE. 2008;96:1254–1265.
-
- Ginkel M, et al. Modular modeling of cellular systems with ProMoT/Diva. Bioinformatics. 2003;19:1169–1176. - PubMed
-
- Hucka M, et al. The systems biology markup language (SBML): a medium for representation and exchange of biochemical network models. Bioinformatics. 2003;19:524–531. - PubMed
