Review
. 2009 Jan 15;15(2):431-40.
doi: 10.1158/1078-0432.CCR-08-1059.

Clinical applications of metabolomics in oncology: a review

Affiliations
Review

Clinical applications of metabolomics in oncology: a review

Jennifer L Spratlin et al. Clin Cancer Res. .

Abstract

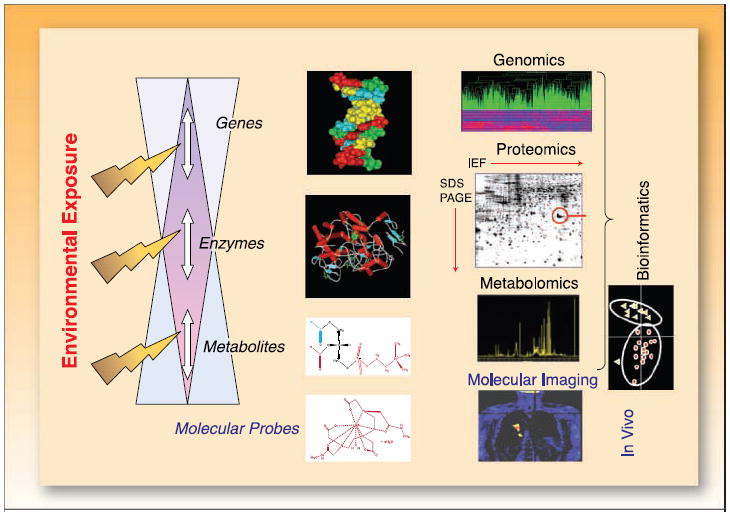
Metabolomics, an omic science in systems biology, is the global quantitative assessment of endogenous metabolites within a biological system. Either individually or grouped as a metabolomic profile, detection of metabolites is carried out in cells, tissues, or biofluids by either nuclear magnetic resonance spectroscopy or mass spectrometry. There is potential for the metabolome to have a multitude of uses in oncology, including the early detection and diagnosis of cancer and as both a predictive and pharmacodynamic marker of drug effect. Despite this, there is lack of knowledge in the oncology community regarding metabolomics and confusion about its methodologic processes, technical challenges, and clinical applications. Metabolomics, when used as a translational research tool, can provide a link between the laboratory and clinic, particularly because metabolic and molecular imaging technologies, such as positron emission tomography and magnetic resonance spectroscopic imaging, enable the discrimination of metabolic markers noninvasively in vivo. Here, we review the current and potential applications of metabolomics, focusing on its use as a biomarker for cancer diagnosis, prognosis, and therapeutic evaluation.


Conflict of interest statement

Disclosure of Potential Conflicts of Interest No potential conflicts of interest were disclosed.

Figures

Fig. 1
Fig. 1
The flow of the “omics”sciences: genomics, proteomics, and metabolomics technologies in individualized medicine for cancer patients. Metabolomics deals with global metabolic profiling and its dynamic changes by monitoring as many as possible endogenous low-weight metabolites in a single analytic assay. Metabolic changes occur through a number of mechanisms, including direct genetic regulation and alterations in enzymatic and metabolic reactions. Techniques applied to metabolic profiling include NMR spectroscopy and MS. Bioinformatics, using techniques developed in the fields of computational science and statistics, remains a key element in data management and analysis of collected data sets. Identified genes, proteins, and metabolites can be assessed by tracer-based molecular imaging using MRI/MRSI and PET.
Fig. 2
Fig. 2
Three major steps of metabolomics analysis. The example is given for imatinib treatment in chronic myeloid leukemia cells using (1) 1H-NMR spectra of cell extracts followed by principal component analysis for pattern recognition → (2) metabolite identification resulting in a biomarker → (3) metabolite quantification and validation. Adapted and reproduced with permission from Thomson Scientific and Serkova NJ, Spratlin JL, Eckhardt SG: NMR-based metabolomics: Translational application and treatment of cancer. Current Opinion in Molecular Therapeutics 2007; 9(6):572–85. Figure 4. ©2007 Thomson Scientific.
Fig. 3
Fig. 3
Preclinical to clinical translation of metabolomics discoveries in breast cancer. Proton magnetic resonance spectra distinguishing between (A) orthotopically grown xenograft tumors of malignant human MDA-MB-231 breast cancer and (B) nonmalignant human MCF-12A mammary epithelial cells showing low glycerophosphocholine and high phosphocholine levels in breast cancer compared with high glycerophosphocholine and low phosphocholine in nonmalignant epithelial cells. C, MRSI of a palpable mass in a 56-y-old female, which was a biopsy-proven cancer of the breast with a corresponding Cho peak (top), whereas a suspicious lesion detected at screening MRI in the breast of a 38-y-old female, positive for the BRCA1 gene, shows no spectral Cho peak and was benign at biopsy. GPC, glycerophosphocholine; PC, phosphocholine; tCho, total choline containing metabolites; Cho, choline; Lip, lipid; Lac, lactate. (A and B) Adapted and reproduced with permission from the American Association for Cancer Research (AACR), Inc.: Morvan D, Demidem A. Metabolomics by proton nuclear magnetic resonance spectroscopy of the response to chloroethylnitrosourea reveals drug efficacy and tumor adaptive metabolic pathways. Cancer Research 2007; 67:2150–9. Figure 3. © 2007 AACR, Inc. (C) Reproduced with permission fromThe Radiological Society of North America (RSNA) and Dr. Bartella: Bartella L, Thakur SB, Morris EA, et al. Enhancing nonmass lesions in the breast: evaluation with proton (1H) MR spectroscopy. Radiology 2007; 245:80–7, Figures 3 and 5. © 2007 RSNA.
Fig. 4
Fig. 4
Use of metabolomics for ovarian cancer detection. Use of NMR metabolite detection followed by principal component analysis shows considerable separation between (A) epithelial ovarian cancer (■) and premenopausal women (▼) and (B) epithelial ovarian cancer (■) and postmenopausal women (▼) as depicted by group clustering. Adapted and reproduced with permission of Wiley-Liss, Inc., a subsidiary of JohnWiley & Sons, Inc. Odunsi K, Wollman RM, Ambrosone CB, et al. Detection of epithelial ovarian cancer using 1H-NMR-based metabolomics. Int. J. Cancer; 113:782–88. Figure 3. © 2005 JohnWiley & Sons, Inc.
Fig. 5
Fig. 5
Metabolomic changes as a pharmacodynamic marker of treatment response. Metabolomic profiling of B16 melanoma (top) and 3LL pulmonary carcinoma tumors (bottom) showing variations in multiple metabolites before (black columns) and after (gray columns) chloroethylnitrosurea treatment. Bars, SD. Vertical scale, percentage of change respect to untreated group. Inset, log scale for metabolites with the largest variations. *, P < 0.05; **, P < 0.01; ***, P < 0.001. Glc, glycine; Lac, lactate; Ala, alanine; Suc, succinate; Ace, acetate; PUF, polyunsaturated fatty acid; Gln, glutamine; Glu, glutamate; Asp, aspartate; Pro, proline; Arg, arginine; Leu, leucine; Lys, lysine; Met, methionine;Thr, threonine; Phe, phenylalanine;Tyr, tyronsine; tCr, total creatinine; DMG, dimethylglycine; For, formate; Gly, glycine; hTa, hypotaurine;Tau, taurine; Cho, choline; GPC, glycerophosphocholine; GPE, glycerophosphoethanolamine; PC, phosphocholine; PE, phosphoethanolamine; PtC, phosphotidylcholine. Adapted and reproduced with permission from theAmerican Association for Cancer Research (AACR), Inc.: Glunde K, Jie C, Bhulwalla ZM. Molecular causes of the aberrant choline phospholipid metabolism in breast cancer. Cancer Research 2004; 64:4270–6. Figure 3. © 2007 AACR, Inc.

References

    1. Fiehn O. Metabolomics—the link between genotypes and phenotypes. Plant Mol Biol. 2002;48:155–71. - PubMed
    1. Griffin JL, Shockcor JP. Metabolic profiles of cancer cells. Nat Rev Cancer. 2004;4:551–61. - PubMed
    1. Kell DB, Mendes P. Snapshots of systems: metabolic control analysis and biotechnology in the post-genomic era. In: Cornish-Bowden A, Cardenas ML, editors. Technological and medical implications of metabolic control analysis. Dordrecht (The Netherlands): Kluwer Academic Publishers; 2000. pp. 3–25.
    1. Ryan D, Robards K. Metabolomics: The greatest omics of them all? Anal Chem. 2006;78:7954–8. - PubMed
    1. Dunn WB, Bailey NJ, Johnson HE. Measuring the metabolome: current analytical technologies. Analyst. 2005;130:606–25. - PubMed

Publication types

Substances