. 2009 Mar;296(3):G499-509.
doi: 10.1152/ajpgi.90526.2008. Epub 2009 Jan 15.

Expression and subcellular localization of BNIP3 in hypoxic hepatocytes and liver stress

Affiliations

Expression and subcellular localization of BNIP3 in hypoxic hepatocytes and liver stress

Mallikarjuna R Metukuri et al. Am J Physiol Gastrointest Liver Physiol. 2009 Mar.

Abstract

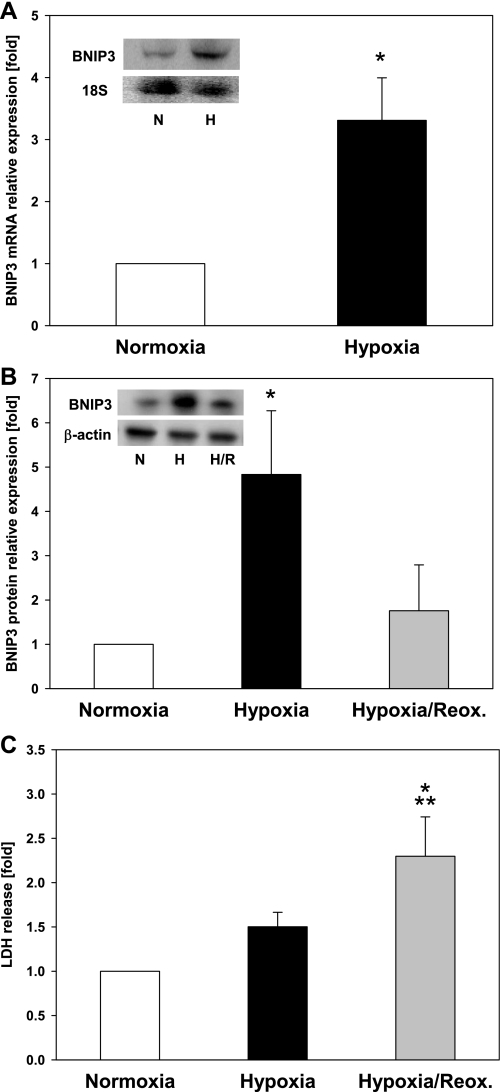
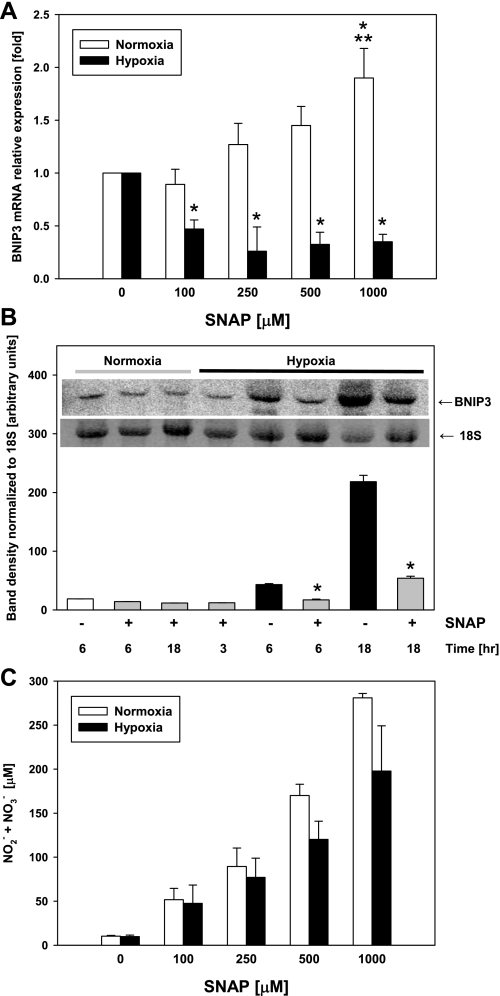
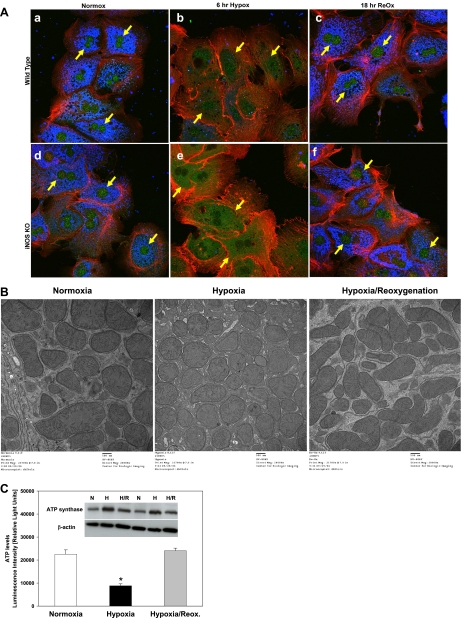
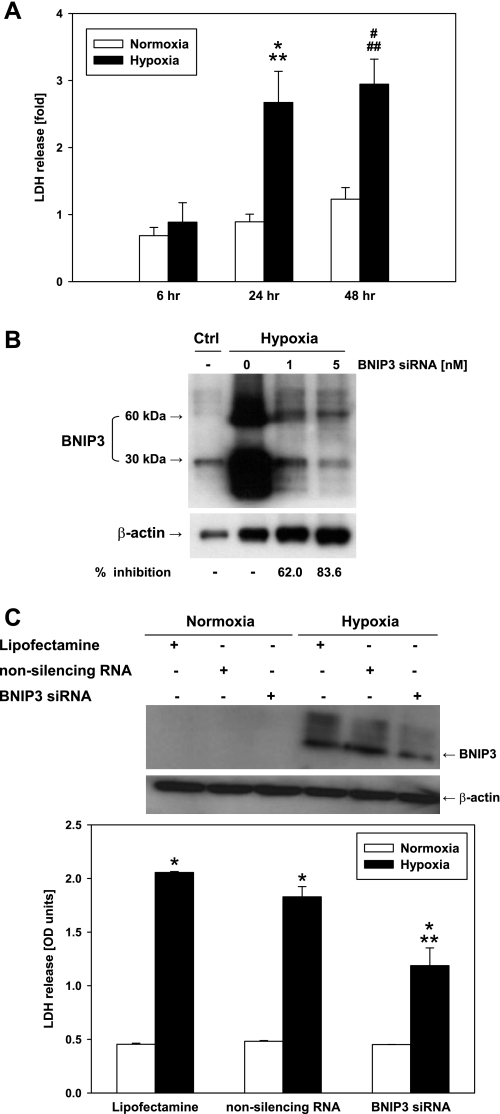
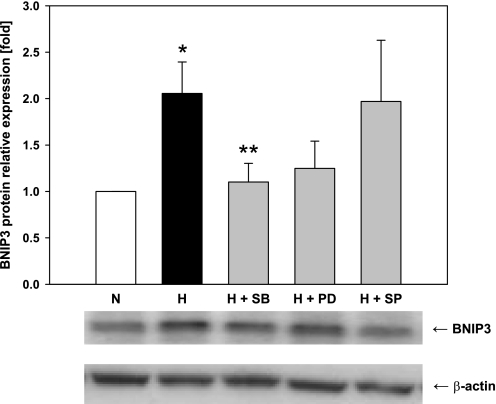
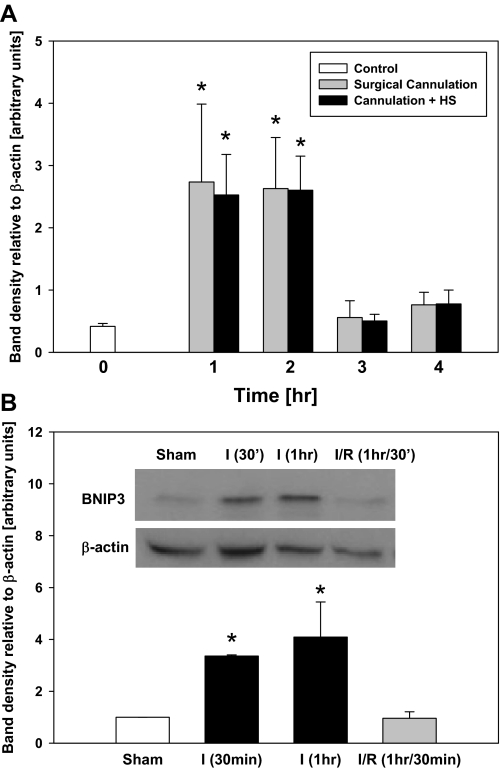
We have previously demonstrated that the Bcl-2/adenovirus EIB 19-kDa interacting protein 3 (BNIP3), a cell death-related member of the Bcl-2 family, is upregulated in vitro and in vivo in both experimental and clinical settings of redox stress and that nitric oxide (NO) downregulates its expression. In this study we sought to examine the expression and localization of BNIP3 in murine hepatocytes and in a murine model of hemorrhagic shock (HS) and ischemia-reperfusion (I/R). Freshly isolated mouse hepatocytes were exposed to 1% hypoxia for 6 h followed by reoxygenation for 18 h, and protein was isolated for Western blot analysis. Hepatocytes grown on coverslips were fixed for localization studies. Similarly, livers from surgically cannulated C57Bl/6 mice and from mice cannulated and subjected to 1-4 h of HS were processed for protein isolation and Western blot analysis. In hepatocytes, BNIP3 was expressed constitutively but was upregulated under hypoxic conditions, and this upregulation was countered by treatment with a NO donor. Surprisingly, BNIP3 was localized in the nucleus of normoxic hepatocytes, in the cytoplasm following hypoxia, and again in the nucleus following reoxygenation. Upregulation of BNIP3 partially required p38 MAPK activation. BNIP3 contributed to hypoxic injury in hepatocytes, since this injury was diminished by knockdown of BNIP3 mRNA. Hepatic BNIP3 was also upregulated in two different models of liver stress in vivo, suggesting that a multitude of inflammatory stresses can lead to the modulation of BNIP3. In turn, the upregulation of BNIP3 appears to be one mechanism of hepatocyte cell death and liver damage in these settings.


Figures

Fig. 1.
Fig. 1.
Effect of hypoxia and hypoxia-reoxygenation (H/R) on Bcl-2/adenovirus EIB 19-kDa interacting protein 3 (BNIP3) expression in hepatocytes. Freshly isolated rat and mouse hepatocytes were exposed to hypoxia (H; 1% O2) for 6 h with or without reoxygenation for 18 h, and the mRNA and protein were isolated and analyzed as described in materials and methods. Control samples were hepatocytes cultured under normoxic (i.e., nonischemia) conditions (N). A: Northern blot analysis for BNIP3 mRNA in rat hepatocytes. A representative blot (inset) and the densitometric quantification of 5 independent experiments are shown. *P = 0.01 vs. normoxia. Data were analyzed by Student's t-test. B: Western blot analysis for BNIP3 protein in mouse hepatocytes. A representative blot (inset) and the densitometric quantification of 5 independent experiments are shown. *P < 0.05 vs. normoxia and H/R. Data were analyzed by 1-way ANOVA followed by Student-Newman-Keuls test. Reox, reoxygenation. C: lactate dehydrogenase (LDH) release in mouse hepatocytes exposed to hypoxia or H/R. Results are means ± SE (n = 9–16). *P < 0.001 vs. normoxia. **P < 0.05 vs. hypoxia. Data were analyzed by 1-way ANOVA followed by Tukey's test.
Fig. 2.
Fig. 2.
Effect of hypoxia on BNIP3 expression in the presence of NO in hepatocytes. Freshly isolated rat and mouse hepatocytes were exposed to hypoxia (1% O2) in the presence or absence of SNAP (100–1,000 μM), and the mRNA was isolated and analyzed as described in materials and methods. Control samples were hepatocytes cultured under normoxic conditions. A: Northern blot analysis for BNIP3 mRNA in rat hepatocytes. Data were normalized using 18S band density as loading control and represent fold change vs. respective nontreated controls. Results are means ± SE (n = 4). *P < 0.01 vs. 0 SNAP. **P < 0.01 vs. 100 μM SNAP. Data were analyzed by 1-way ANOVA followed by the Tukey's test. B: Northern blot analysis (inset) and densitometric quantification for BNIP3 mRNA in mouse hepatocytes cultured under normoxic or hypoxic conditions in the presence or absence of SNAP (100 μM) as indicated. Results are means ± SE (n = 3). *P < 0.001 vs. normoxia. Data were analyzed by Student's t-test. C: levels of nitrite/nitrate (NO2/NO3) in supernatants of rat hepatocytes cultured in the presence or absence of SNAP under normoxic or hypoxic conditions as indicated. Results are means ± SE of 4 independent experiments.
Fig. 3.
Fig. 3.
Effect of hypoxia and H/R on BNIP3 subcellular localization in wild-type and inducible NO synthase (iNOS)-null mouse hepatocytes. A: freshly isolated hepatocytes (wild type, a–c; iNOS null, d–f) were cultured under normoxic (control; a and d) or hypoxic conditions (1% O2; b and e) for 6 h. Parallel hypoxic cultures were returned to the normoxic incubator for 18 h of reoxygenation (c and f). Cells were then fixed and processed for confocal immunofluorescence imaging as described in materials and methods. Fluorescent labeling: BNIP3, green; ATP synthase, blue; F-actin, red. B: in parallel experiments, cells were fixed and processed for transmission electron microscopy as described in materials and methods. Compared with normoxic control, no loss of mitochondria was observed after exposure to hypoxia (6 h) or H/R for 18 h. C: freshly isolated hepatocytes were cultured under normoxic (control) or hypoxic conditions (1% O2) for 6 h. Parallel hypoxic cultures were returned to the normoxic incubator for 18 h of reoxygenation. ATP levels were measured using the CellTiter-Glo luminescent cell viability assay kit as described in materials and methods. Results are means ± SE (n = 6). *P < 0.001 vs. normoxia and H/R. Data were analyzed by 1-way ANOVA followed by Tukey's test. Inset shows a Western blot for ATP synthase protein expression under the same experimental conditions as described above (n = 2).
Fig. 4.
Fig. 4.
BNIP3 small interference (si)RNA protects hepatocytes from hypoxia-induced cell injury. A: freshly isolated mouse hepatocytes were exposed to 6, 24, and 48 h of hypoxia (1% O2), and viability was assessed by LDH release. Results are means ± SE (n = 9–16). *P < 0.005 vs. normoxia, 24 h. **P < 0.05 vs. hypoxia, 6 h. #P < 0.01 vs. normoxia, 48 h. ##P < 0.005 vs. hypoxia, 6 h. Data were analyzed by 1-way ANOVA followed by Tukey's test. B: after transient transfection with BNIP3 siRNA (1 and 5 nM), primary mouse hepatocytes were exposed to 24 h of hypoxia and the total protein was isolated. A representative Western blot showing the knockdown of BNIP3 gene is shown (n = 3). The inhibition of BNIP3 protein expression was calculated using the densitometric analysis for the 30-kDa band. Ctrl, control. C: freshly isolated mouse hepatocytes were treated with Lipofectamine, nonsilencing (scrambled) RNA, and BNIP3 siRNA (5 nM) for 24 h of hypoxia (1% O2), and viability was assessed by LDH release. OD, optical density. *P < 0.001 vs. normoxia. **P < 0.001 vs. hypoxia (Lipofectamine and nonsilencing RNA). Data were analyzed by 1-way ANOVA followed by Tukey's test. Representative Western blot (top) shows BNIP3 protein expression under the same experimental conditions as described above.
Fig. 5.
Fig. 5.
Effect of MAPK inhibitors on hypoxia-induced BNIP3 expression in mouse hepatocytes. Freshly isolated rat and mouse hepatocytes were exposed to hypoxia (1% O2) for 6 h in the presence or absence of the specific MAPK inhibitors SB 203580 (SB), PD 98059 (PD), and SP600125 (SP), all at 3 μM. Protein was isolated and analyzed as described in materials and methods. Control samples were hepatocytes cultured under normoxic conditions. A representative Western blot and the densitometric quantification of 8–12 independent experiments are shown. *P < 0.01 vs. normoxia. **P < 0.05 vs. hypoxia. Data were analyzed by 1-way ANOVA followed by Tukey's test.
Fig. 6.
Fig. 6.
Hepatic BNIP3 expression in vivo. A: livers from mice subjected to surgical cannulation or surgical cannulation plus hemorrhagic shock (HS; bleeding to 25 mmHg maintained for 1, 2, 3, or 4 h) were collected, and Western blot analysis for BNIP3 protein was performed. Livers from resting untreated animals served as controls. Results are means ± SE (n = 5–9 animals/group). *P < 0.05 vs. control, 3 h of surgical cannulation, and 3 h of cannulation + HS. Data were analyzed by 1-way ANOVA followed by Student-Newman-Keuls test. B: livers from mice subjected to segmental (70%) hepatic warm ischemia for 30 min or 1 h or 1 h of ischemia followed by 30 min of reperfusion (I/R) were collected, and Western blot analysis for BNIP3 protein was performed. Livers from sham animals served as controls. Results are means ± SE (n = 2–3 animals/group). *P < 0.05 vs. sham and I/R. Data were analyzed by 1-way ANOVA followed by Tukey's test.

References

    1. Althaus J, Bernaudin M, Petit E, Toutain J, Touzani O, Rami A. Expression of the gene encoding the pro-apoptotic BNIP3 protein and stimulation of hypoxia-inducible factor-1alpha (HIF-1alpha) protein following focal cerebral ischemia in rats. Neurochem Int 48: 687–695, 2006. - PubMed
    1. An HJ, Maeng O, Kang KH, Lee JO, Kim YS, Paik SG, Lee H. Activation of Ras up-regulates pro-apoptotic BNIP3 in nitric oxide-induced cell death. J Biol Chem 281: 33939–33948, 2006. - PubMed
    1. Azad MB, Chen Y, Henson ES, Cizeau J, Millan-Ward E, Israels SJ, Gibson SB. Hypoxia induces autophagic cell death in apoptosis-competent cells through a mechanism involving BNIP3. Autophagy 4: 195–204, 2008. - PMC - PubMed
    1. Boyd JM, Malstrom S, Subramanian T, Venkatesh LK, Schaeper U, Elangovan B, D'Sa-Eipper C, Chinnadurai G. Adenovirus E1B 19 kDa and Bcl-2 proteins interact with a common set of cellular proteins. Cell 79: 341–351, 1994. - PubMed
    1. Bruick RK Expression of the gene encoding the proapoptotic Nip3 protein is induced by hypoxia. Proc Natl Acad Sci USA 97: 9082–9087, 2000. - PMC - PubMed

Publication types

MeSH terms

LinkOut - more resources