. 2009 Feb;174(2):550-64.
doi: 10.2353/ajpath.2009.080631. Epub 2009 Jan 15.

Molecular classification of rhabdomyosarcoma--genotypic and phenotypic determinants of diagnosis: a report from the Children's Oncology Group

Affiliations

Molecular classification of rhabdomyosarcoma--genotypic and phenotypic determinants of diagnosis: a report from the Children's Oncology Group

Elai Davicioni et al. Am J Pathol. 2009 Feb.

Abstract

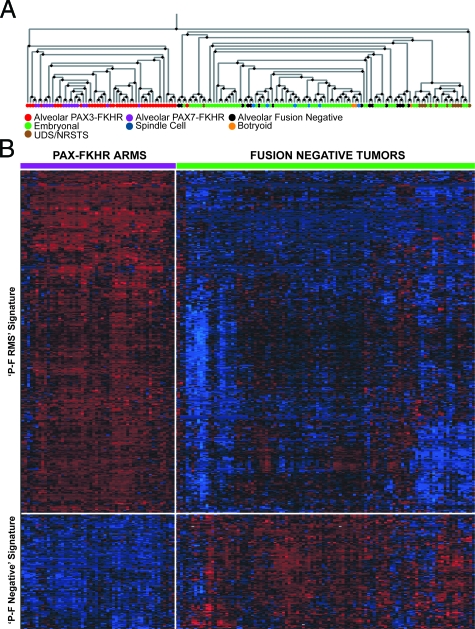
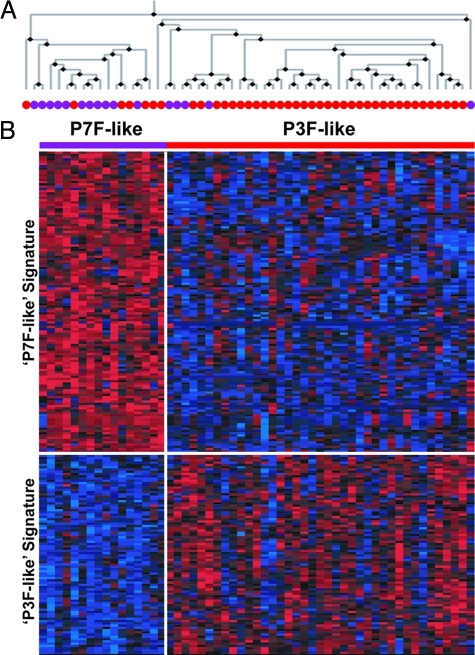
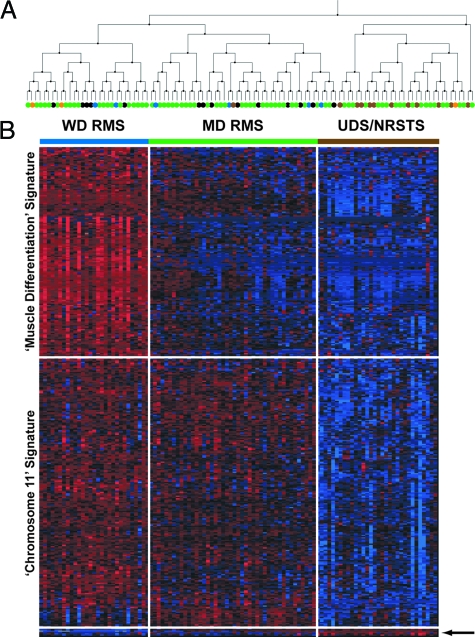
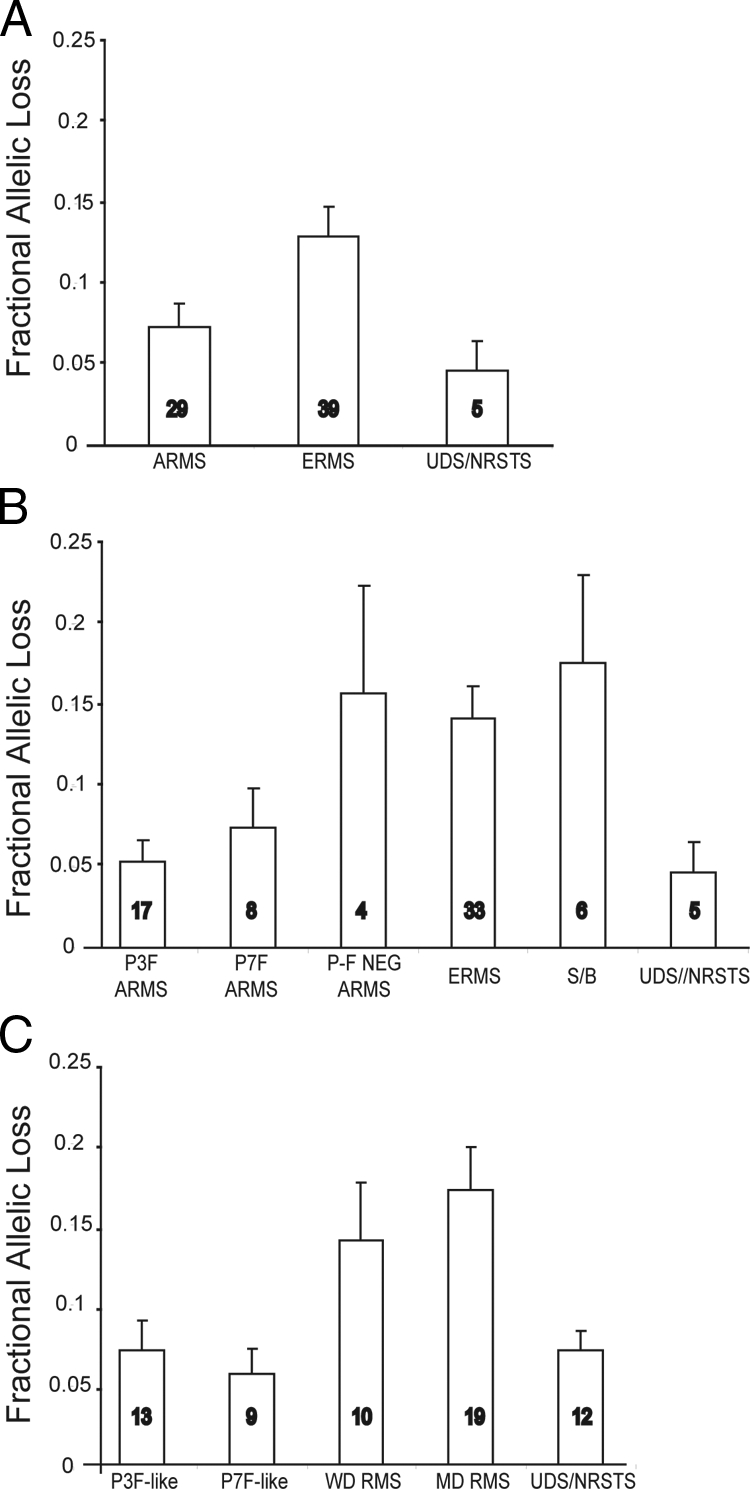
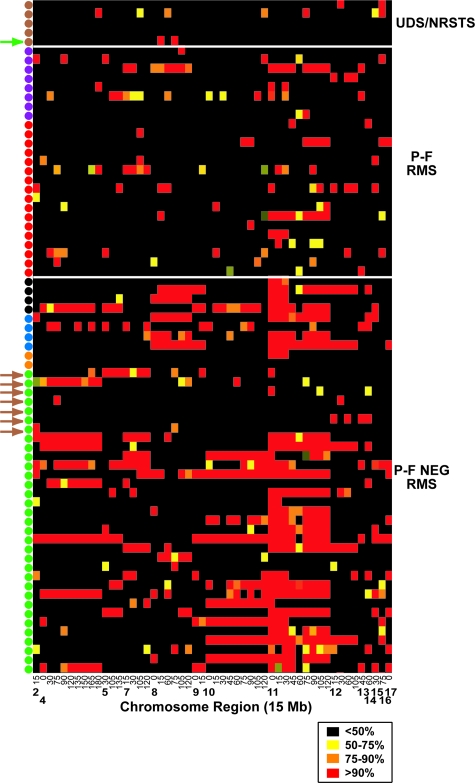
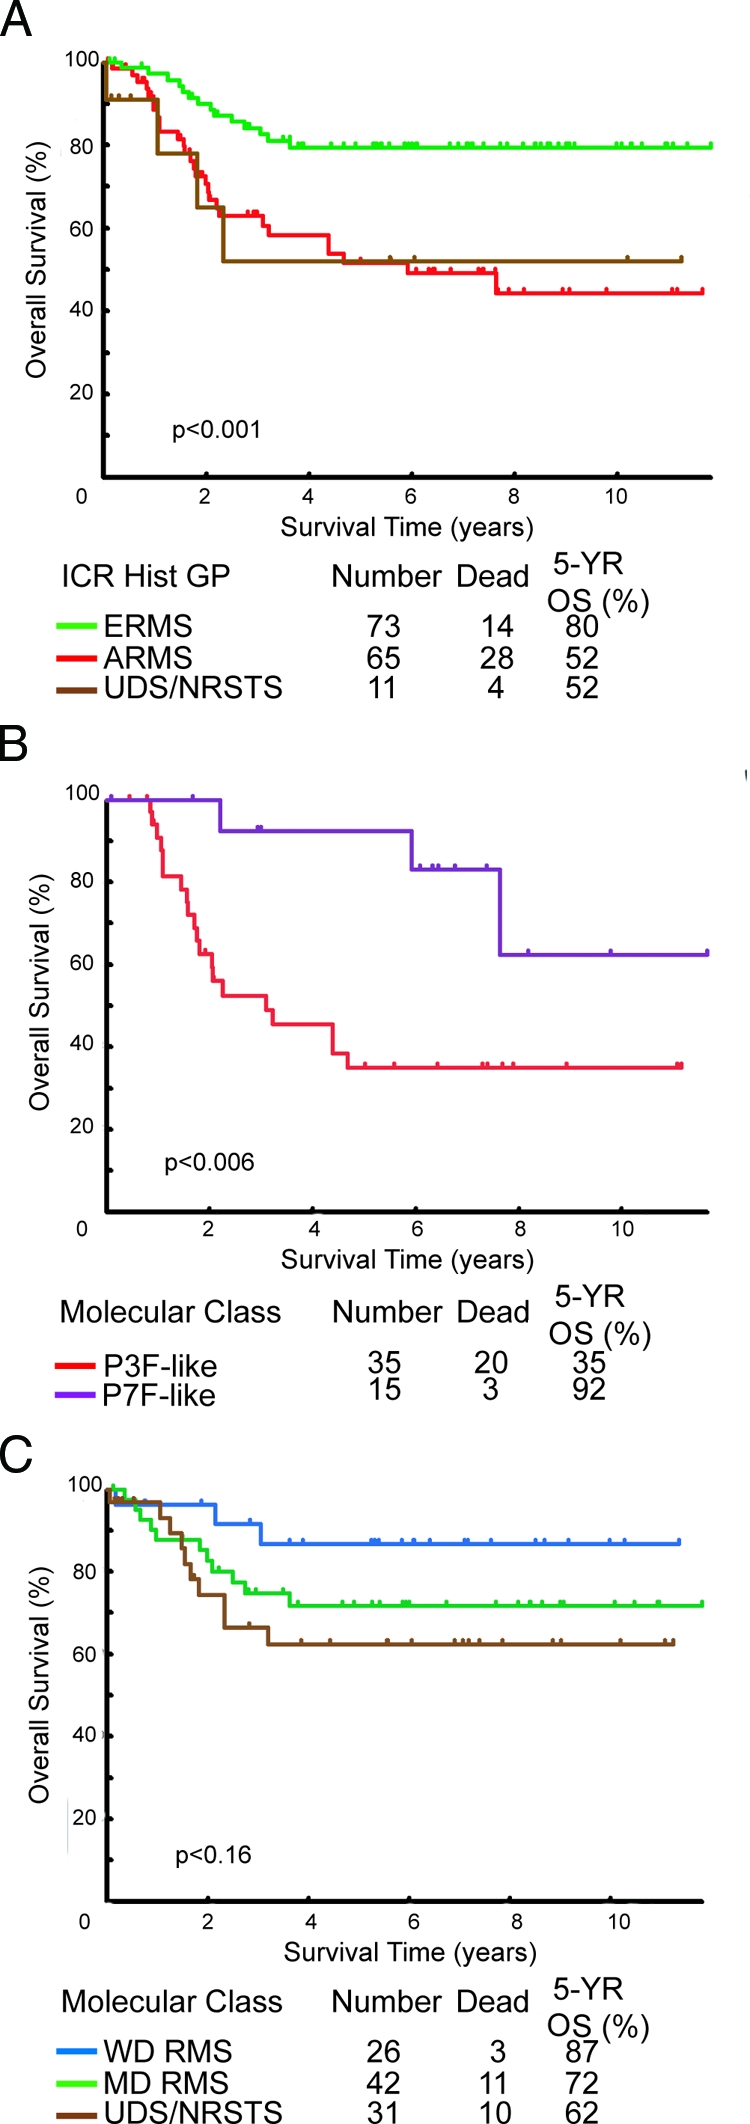
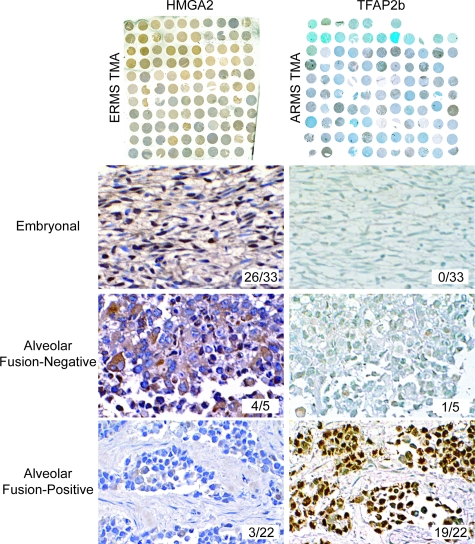
Rhabdomyosarcoma (RMS) in children occurs as two major histological subtypes, embryonal (ERMS) and alveolar (ARMS). ERMS is associated with an 11p15.5 loss of heterozygosity (LOH) and may be confused with nonmyogenic, non-RMS soft tissue sarcomas. ARMS expresses the product of a genomic translocation that fuses FOXO1 (FKHR) with either PAX3 or PAX7 (P-F); however, at least 25% of cases lack these translocations. Here, we describe a genomic-based classification scheme that is derived from the combined gene expression profiling and LOH analysis of 160 cases of RMS and non-RMS soft tissue sarcomas that is at variance with conventional histopathological schemes. We found that gene expression profiles and patterns of LOH of ARMS cases lacking P-F translocations are indistinguishable from conventional ERMS cases. A subset of tumors that has been histologically classified as RMS lack myogenic gene expression. However, classification based on gene expression is possible using as few as five genes with an estimated error rate of less than 5%. Using immunohistochemistry, we characterized two markers, HMGA2 and TFAP2ss, which facilitate the differential diagnoses of ERMS and P-F RMS, respectively, using clinical material. These objectively derived molecular classes are based solely on genomic analysis at the time of diagnosis and are highly reproducible. Adoption of these molecular criteria may offer a more clinically relevant diagnostic scheme, thus potentially improving patient management and therapeutic RMS outcomes.


Figures

Figure 1
Figure 1
Semi-supervised expression profiling of RMS and NRSTS tumors. The Kruskal-Wallis H test was used to identify 485 differentially expressed genes (used in at least 50% of the metaclustering rounds) between three main ICR histological groups (ARMS, ERMS, and NRSTS) throughout 2000 rounds of reiterative cross-validated metaclustering. A: Dendrogram derived from Pearson’s correlation complete linkage hierarchical clustering of 160 tumor samples, depicts two main branches that discriminate P-F RMS and all other P-F-negative tumors. The colored legend indicates tumor histology (review diagnosis) and PAX-FKHR (PAX-FOXO1) fusion status (ARMS only). B: Expression matrix depicting the expression patterns of two main gene clusters of 363 and 122 genes differentially expressed between P-F RMS and P-F-negative tumors (ie, two main branches of dendrogram in A). The expression of each gene in each sample was normalized in the pseudo-colored heatmap by the number of standard deviations above (red) and below (blue) the median expression value (black) across all samples.
Figure 2
Figure 2
Semi-supervised expression profiling of P-F RMS tumors. P-F-expressing ARMS tumors (n = 55) were subjected to two consecutive rounds of cross-validated metaclustering. The results of the second round of metaclustering are presented in the hierarchical clustering dendrogram (A) and expression matrix (B). Most PAX7-FKHR (purple dots) ARMS co-cluster on the left branch of the dendrogram with five PAX3-FKHR ARMS. The left branch is comprised of mainly PAX3-FKHR ARMS (red dots) but also includes five PAX7-FKHR ARMS (∼30% of this group). The expression matrix depicts the 134-gene P7F-like expression signature, with mean expression for the P7F-like tumors (purple bar) 2.8-fold greater than P3F-like tumors (P < 0.0001) and the 88-gene P3F-like expression signature, with mean expression for the P3F-like tumors (red bar) 2.9-fold higher than in P7F-like tumors (P < 0.0001). The expression of each gene in each sample was normalized in the pseudo-colored heatmap by the number of standard deviations above (red) and below (blue) the median expression value (black) across all samples.
Figure 3
Figure 3
Semi-supervised expression profiling of P-F-negative tumors. PAX-FKHR fusion-negative tumors (n = 105) were subjected to two consecutive rounds of cross-validated metaclustering. The results of the second round of metaclustering are presented in the hierarchical clustering dendrogram (A) and expression matrix (B). Three main sample clusters are resolved, two clusters on the left branch comprised of an assortment of histological subtypes of P-F-negative RMS and one cluster on the right branch contained most of the NRSTS tumors but also ∼27% of all ERMS tumors. See Figure 1 for tumor sample color legend. The expression matrix depicts the 176-gene muscle differentiation expression signature, highly expressed in well-differentiated WD RMS (blue bar), with mean expression levels 3- and 12-fold greater than in moderately-differentiated MD RMS (green bar) and the UDS/NRSTS (brown bar) tumor classes, respectively (P < 0.0001). The 203-gene chromosome 11 expression signature is expressed at similar levels in WD and MD RMS classes, both more than threefold greater than UDS/NRSTS tumors (P < 0.0001). A small gene cluster of just six genes is expressed at increased levels in the UDS/NRSTS class (arrow). The expression of each gene in each sample was normalized in the pseudo-colored heatmap by the number of standard deviations above (red) and below (blue) the median expression value (black) across all samples.
Figure 4
Figure 4
Genome-wide allelic imbalance of RMS and NRSTS using single nucleotide polymorphism microarray analysis. A: Mean fractional allelic loss for each of the three main ICR histological groups (analysis of variance, P < 0.005). B: Mean fractional allelic loss in which ARMS tumors are subdivided by P-F fusion status and ERMS tumors by histological variants (ERMS = classical embryonal, S/B = spindle or botryoid) (P < 0.006). C: Mean fractional allelic loss for tumors according to gene expression-based molecular classes (P < 0.003). Numbers in bars indicate the number of tumors analyzed.
Figure 5
Figure 5
Genome-wide patterns of LOH, as determined across 15-Mb windows in 29 ARMS, 39 ERMS, and 5 NRSTS tumors. LOH regions are labeled at the bottom of the LOH map according to chromosome and the region start point in Mb from the p-terminus. LOH map is color-coded in the legend according to the probability of LOH as determined by the expected versus observed heterozygous frequency. Samples are color-coded in legend as in Figure 1. Brown and green arrows indicate seven ERMS tumors that co-clustered with UDS/NRSTS and an NRSTS tumor that co-clustered with MD RMS molecular class, respectively.
Figure 6
Figure 6
Kaplan-Meier overall survival estimates comparing conventional and molecular classes. A: Patient overall survival by ICR histology-based classification. B and C: Patient overall survival for gene expression-based classes of P-F RMS (ARMS) and P-F-negative tumors (ERMS, ARMS, UDS/NRSTS), respectively. Log-rank test P values in tests for homogeneity are indicated below the curves.
Figure 7
Figure 7
Immunohistochemical analysis of an independent set of RMS TMAs validates oligonucleotide microarray results and demonstrates the utility of TFAP2β and HMGA2 in RMS diagnosis on formalin-fixed tissue. ERMS TMA with antibodies detecting HMGA2 (left) and ARMS TMA (right) with antibodies detecting TFAP2β are shown on the top row. Representative serial tumor sections are shown staining for HMGA2 (left column, embryonal and alveolar fusion-negative) and TFAP2β (right column, PAX3-FKHR alveolar). Insets show number of positively staining tumors out of total. ERMS and ARMS TMA were counterstained with hematoxylin and methyl green, respectively. Original magnifications, ×200.

References

    1. Asmar L, Gehan EA, Newton WA, Webber BL, Marsden HB, van Unnik AJ, Hamoudi AB, Shimada H, Tsokos M, Harms D. Agreement among and within groups of pathologists in the classification of rhabdomyosarcoma and related childhood sarcomas. Report of an international study of four pathology classifications. Cancer. 1994;74:2579–2588. - PubMed
    1. Enterline HT, Horn RC., Jr Alveolar rhabdomyosarcoma; a distinctive tumor type. Am J Clin Pathol. 1958;29:356–366. - PubMed
    1. Newton WA, Jr, Gehan EA, Webber BL, Marsden HB, van Unnik AJ, Hamoudi AB, Tsokos MG, Shimada H, Harms D, Schmidt D. Classification of rhabdomyosarcomas and related sarcomas. Pathologic aspects and proposal for a new classification—an Intergroup Rhabdomyosarcoma Study. Cancer. 1995;76:1073–1085. - PubMed
    1. Riopelle JL, Thériault JP. Sur une forme méconnue de sarcome des parties molles: le rhabdomyosarcome alvéolaire. Ann Anat Pathol (Paris) 1956;1:88–111. - PubMed
    1. Tsokos M, Webber BL, Parham DM, Wesley RA, Miser A, Miser JS, Etcubanas E, Kinsella T, Grayson J, Glatstein E. Rhabdomyosarcoma: a new classification scheme related to prognosis. Arch Pathol Lab Med. 1992;116:847–855. - PubMed

Publication types

MeSH terms