. 2009 Jan;5(1):e1000263.
doi: 10.1371/journal.ppat.1000263. Epub 2009 Jan 16.

miR-198 inhibits HIV-1 gene expression and replication in monocytes and its mechanism of action appears to involve repression of cyclin T1

Affiliations

miR-198 inhibits HIV-1 gene expression and replication in monocytes and its mechanism of action appears to involve repression of cyclin T1

Tzu-Ling Sung et al. PLoS Pathog. 2009 Jan.

Abstract

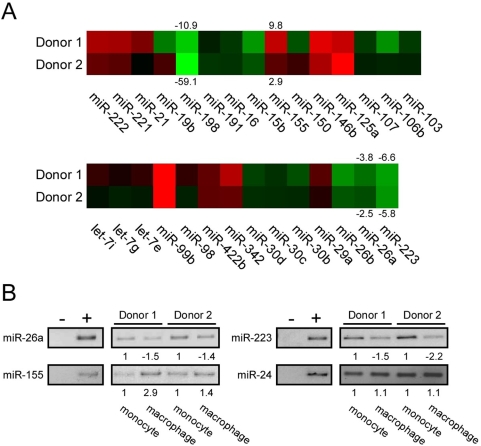
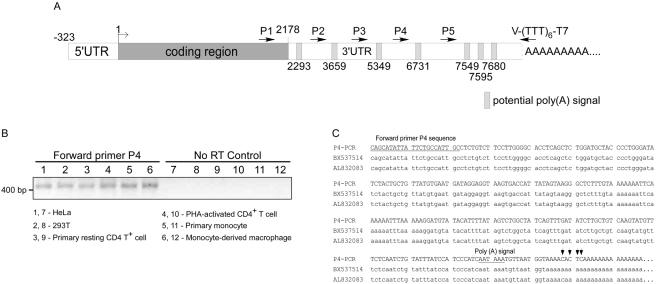
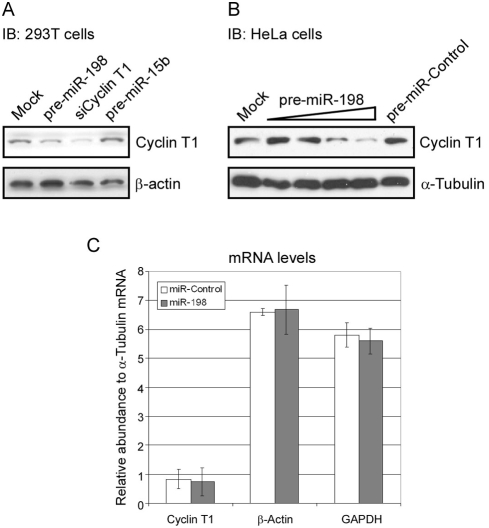
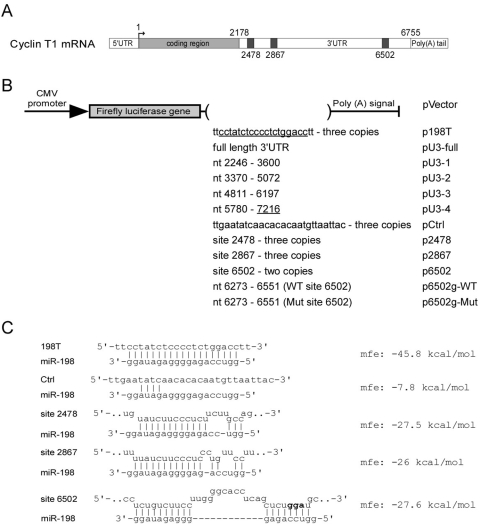
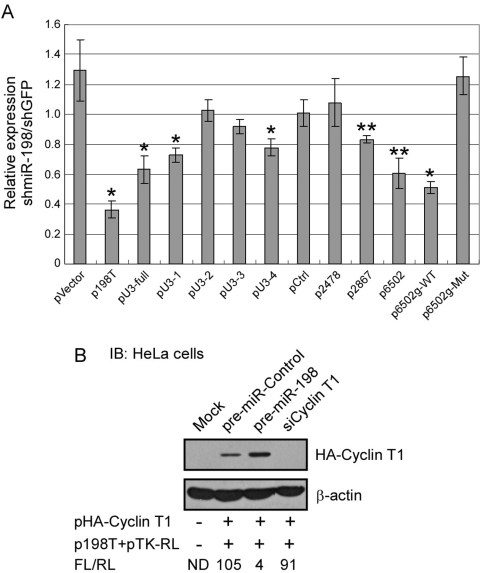
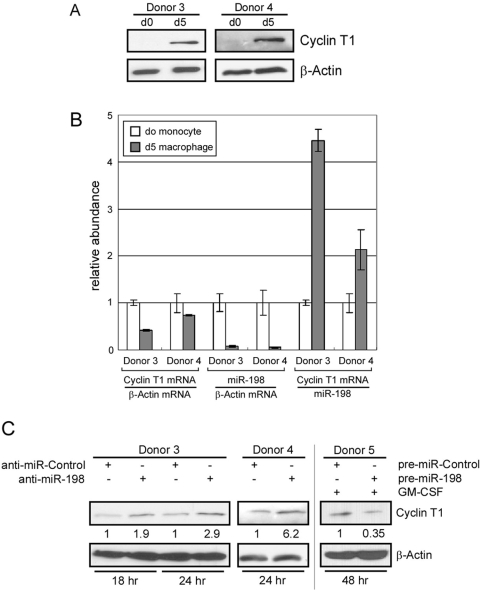
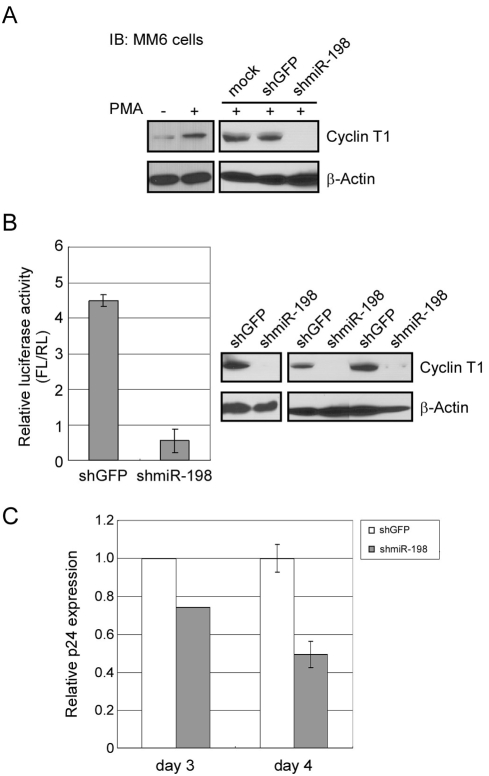
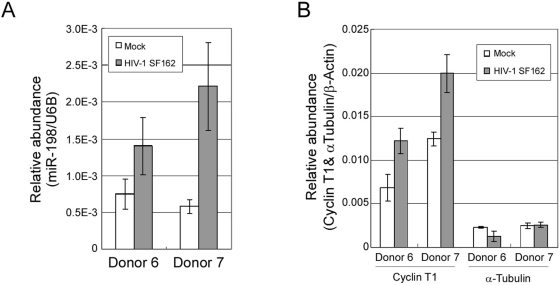
Cyclin T1 is a regulatory subunit of a general RNA polymerase II elongation factor known as P-TEFb. Cyclin T1 is also required for Tat transactivation of HIV-1 LTR-directed gene expression. Translation of Cyclin T1 mRNA has been shown to be repressed in human monocytes, and this repression is relieved when cells differentiate to macrophages. We identified miR-198 as a microRNA (miRNA) that is strongly down-regulated when monocytes are induced to differentiate. Ectopic expression of miR-198 in tissue culture cells reduced Cyclin T1 protein expression, and plasmid reporter assays verified miR-198 target sequences in the 3' untranslated region (3'UTR) of Cyclin T1 mRNA. Cyclin T1 protein levels increased when an inhibitor of miR-198 was transfected into primary monocytes, and overexpression of miR-198 in primary monocytes repressed the normal up-regulation of Cyclin T1 during differentiation. Expression of an HIV-1 proviral plasmid and HIV-1 replication were repressed in a monocytic cell line upon overexpression of miR-198. Our data indicate that miR-198 functions to restrict HIV-1 replication in monocytes, and its mechanism of action appears to involve repression of Cyclin T1 expression.


Conflict of interest statement

The authors have declared that no competing interests exist.

Figures

Figure 1
Figure 1. MiRNA expression profile during monocyte to macrophage differentiation.
(A) Heat map for all differentially expressed miRNAs in two blood donors. Each color block represents the ratio of miRNA expression levels of monocytes to macrophages. Red indicates an induction and green indicates a reduction of expression in macrophages, with color intensity correlating with level of change. The fold-change of selected miRNAs is shown above or below the blocks. Positive number indicates an induction and negative number indicates a reduction. (B) Expression of miR-26a, miR-155, miR-223, and miR-24 were evaluated in semi-quantitative PCR assays. Equal amounts of RNA from the indicated RNA preparations from the two donors were used in end-point PCR assays. Negative controls (−) were reaction mixtures without RNA and positive controls (+) were reaction mixtures with human total heart RNA. Quantification of band intensities is shown below each PCR product.
Figure 2
Figure 2. Cyclin T1 mRNA utilizes the fourth poly(A) signal downstream of the coding sequence.
(A) A schematic representation of Cyclin T1 mRNA with 3′UTR end and potential poly(A) signals. The first nucleotide in the coding sequence is defined as +1. The indicated Reverse Transcription primer (T7-(TTT)6-V) contains T7 promoter sequence for PCR amplification and mixed nucleotides (V; A, C, and G) at the 3′ end for specific amplification from the beginning of the poly(A) sequences. Forward primers for PCR (P1 to P5) are indicated by forward arrows. (B) Reverse transcription was conducted with DNase I-treated RNA from HeLa cells, 293T cells, resting and activated primary CD4+ T cells, primary monocytes, and macrophages using primer T7-(TTT)6-V. PCR reactions with primers specific for T7 sequences and each utilized poly(A) signal (P1 to P5) is predicted to yield PCR products of ∼400 bp in length. An agarose gel as shown with products results for primer P4 and control reactions. (C) The sequence of the PCR product obtained with P4 primer shows sequence similarity with two cDNA clones, BX537514 (CoreNucleotide search) and AI832083 (EST search) in GenBank. Arrows indicate differences in nucleotide sequences between the product with the P4 primer and EST sequences.
Figure 3
Figure 3. Ectopic expression of miR-198 down-regulates endogenous Cyclin T1 protein levels without affecting its mRNA levels.
(A) 293T cells were transfected with 150 pmole of pre-miR-198, pre-miR-15b, or siRNA against Cyclin T1 (siCyclin T1) and examined for Cyclin T1 and β-actin protein expression at 72 hours after transfection. IB: immunoblot. (B) Increasing amounts of pre-miR-198 (6.25 pmole to 100 pmole) or pre-miR-Control (100 pmole) were transfected into HeLa cells. Cells were harvest at 72 hours post-transfection to examine the levels of Cyclin T1 and α-tubulin protein expression. (C) Cyclin T1 mRNA levels were examined by RT-real-time PCR and normalized to α-tubulin mRNA levels in pre-miR-198- and miR-Control-transfected HeLa cells. β-actin and GAPDH mRNA levels were also normalized to α-tubulin mRNA. The data shown here are means±SDs of three independent transfections.
Figure 4
Figure 4. miR-198 target sequences in the Cyclin T1 mRNA 3′UTR.
(A) Schematic representation of Cyclin T1 mRNA. Three predicted miR-198 target sequences, site 2478, site 2867, and site 6502, are shown and named according to the position of their first nucleotide in Cyclin T1 mRNA. (B) The indicated luciferase reporter plasmids based upon the CMV immediately-early promoter were constructed by inserting the indicated sequences between the firefly luciferase gene and poly(A) signal. pU3-4 contains additional sequences not included in Cyclin T1 3′UTR and is indicated with underlined number. (C) Predicted binding structures and energies (RNAhybrid) between miR-198 and the three predicted target sequences and control sequences as shown. The three nucleotides in site 6502 in bold font were mutated from gga to cct in p6502g-Mut.
Figure 5
Figure 5. Identification of functional miR-198 target sites in Cyclin T1 3′UTR.
(A) Reporter plasmids described in Figure 4B were co-transfected with a renilla luciferase internal control reporter (thymidine kinase promoter) into shGFP- or shmiR-198-expressing HeLa cell pools. Luciferase activities for firefly and renilla were measured 24 hours post-transfection. Relative luciferase activities (firefly luciferase activity by renilla luciferase activity, FL/RL) were measured for each plasmid. Relative expression was obtained after normalizing of FL/RL in shmiR-198-expressing cells to that in shGFP-expressing cells transfected. The data shown here are means±SDs of three independent transfections. * Students t-test P-value <0.001 compared to pVector. ** Students t-test P-value <0.001 compared to pCtrl. (B) An expression plasmid for HA-Cyclin T1, the p198T firefly luciferase reporter plasmid (Figure 4B) and a TK-renilla luciferase plasmid were co-transfected into HeLa cells with either pre-miR-control, pre-miR-198 or siRNAs against Cyclin T1. Cell extracts were prepared at 24 hours post-transfection and were used for luciferase assays and an immunoblot. The indicated ratios of firefly luciferase to renilla luciferase (FL/RL) was determined.
Figure 6
Figure 6. miR-198 functions to repress Cyclin T1 protein expression in primary monocytes.
(A) Expression levels of Cyclin T1 and β-actin proteins in freshly isolated monocytes (d0) or macrophages allowed to differentiate for five days (d5) were examined in immunoblots for two donors. (B) Expression levels of Cyclin T1 mRNA relative to β-actin mRNA were measured by RT-real-time PCR assay; expression levels of miR-198 were measured using TaqMan MicroRNA assays. The relative abundance was calculated by normalizing of β-actin mRNA or miR-198 levels. Bars represent range in three measurements. (C) miR-198 inhibitor (anti-miR-198) or control inhibitor (anti-miR-Control) were transfected into freshly isolated monocytes from two donors (Donor 3, 4). miR-198 precursor (pre-miR-198) or control precursor (pre-miR-Control) were transfected into freshly isolated monocytes and differentiation was induced with GM-CSF treatment (Donor 5). Cells were harvested by direct lysis at times indicated after transfection and Cyclin T1 protein expression was examined in immunoblots. Quantification of Cyclin T1 protein levels is shown below each band (normalized to β-actin).
Figure 7
Figure 7. Down-regulation of Cyclin T1 by miR-198 inhibits HIV-1 proviral gene expression and HIV-1 replication.
(A) Left panel: Immunoblot analysis of Cyclin T1 levels in MM6 cells treated with or without PMA for 48 hours. Right panel: MM6 cells were mock-transfected or transfected with shGFP- or shmiR-198-expressing plasmids and then treated with PMA. Cells were harvested 48 hours after PMA treatment and examined for Cyclin T1 expression. β-actin expression was analyzed as a loading control. (B) A HIV-1 NL4-3 firefly luciferase proviral reporter plasmid was co-transfected with shGFP- or shmiR-198-expression plasmids and a renilla luciferase reporter internal control plasmid into MM6 cells. Cells were treated with PMA immediately after transfection, and cell extracts were prepared 48 hours later and divided into two equal portions for dual-luciferase assays and immunoblot analyses. Relative luciferase activity was determined by normalizing firefly luciferase activity to renilla luciferase activity. Two independent transfection experiments were performed; in one experiment transfections were performed in duplicate. For immunoblots to examine Cyclin T1 expression, panel on left represents the single transfection experiment, while panel on right represents the duplicate transfection experiment. Luciferase assays shown are the average of the three transfections with bars representing the range in the three measurements. C. MM6 cells were transfected with shGFP- or shmiR-198-expression plasmids in two independent experiments. Cultures were treated with PMA immediately after transfection and one day later were infected with HIV-1 strain SF162. Expression of p24 in culture supernatants was measured at three days post-infection in experiment 1 and at four days post-infection in experiment 2. The data in experiment 2 show the means±SD of infections carried out in triplicate in the control (shGFP) or shmiR-198 plasmid.
Figure 8
Figure 8. HIV-1 infection of primary macrophages affects miR-198 as well as Cyclin T1 mRNA levels.
Macrophages were infected with HIV-1 SF162 strain for seven days and total RNA was isolated and assayed for: (A) expression levels of miR-198; (B) Cyclin T1 and α-tubulin mRNAs. U6B snRNA was used for normalization of miR-198 and β-actin mRNA was used for normalization of mRNAs. Bars represent the range in the three measurements.

Similar articles

Cited by

References

    1. Peterlin BM, Price DH. Controlling the elongation phase of transcription with P-TEFb. Mol Cell. 2006;23:297–305. - PubMed
    1. Zhou Q, Yik JH. The Yin and Yang of P-TEFb regulation: implications for human immunodeficiency virus gene expression and global control of cell growth and differentiation. Microbiol Mol Biol Rev. 2006;70:646–659. - PMC - PubMed
    1. Fu TJ, Peng J, Lee G, Price DH, Flores O. Cyclin K functions as a CDK9 regulatory subunit and participates in RNA polymerase II transcription. J Biol Chem. 1999;274:34527–34530. - PubMed
    1. Peng J, Zhu Y, Milton JT, Price DH. Identification of multiple cyclin subunits of human P-TEFb. Genes Dev. 1998;12:755–762. - PMC - PubMed
    1. Rice AP, Herrmann CH. Regulation of TAK/P-TEFb in CD4+ T lymphocytes and macrophages. Curr HIV Res. 2003;1:395–404. - PubMed

Publication types