

Medial-to-lateral ratio of tibiofemoral subchondral bone area is adapted to alignment and mechanical load
- PMID: 19148562
- PMCID: PMC2929533
- DOI: 10.1007/s00223-008-9208-4
Medial-to-lateral ratio of tibiofemoral subchondral bone area is adapted to alignment and mechanical load
Abstract
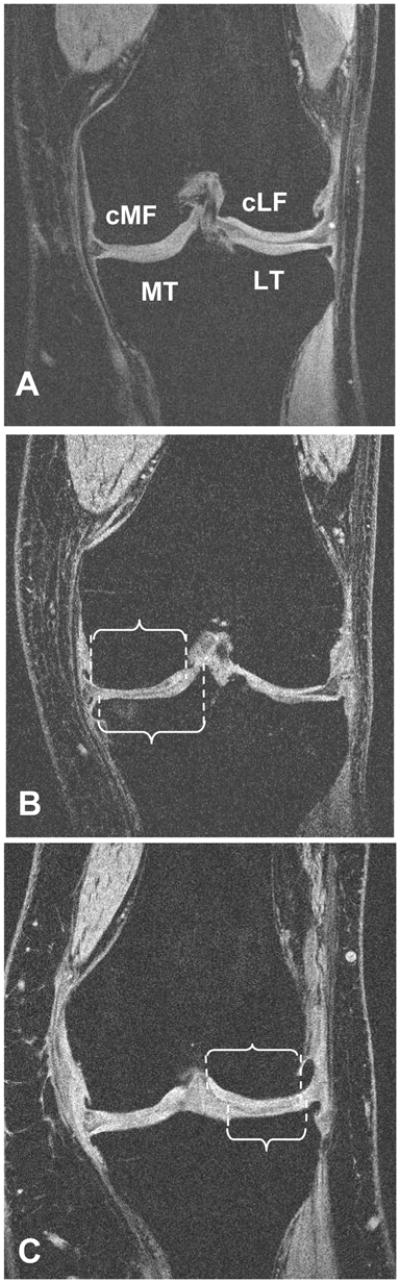
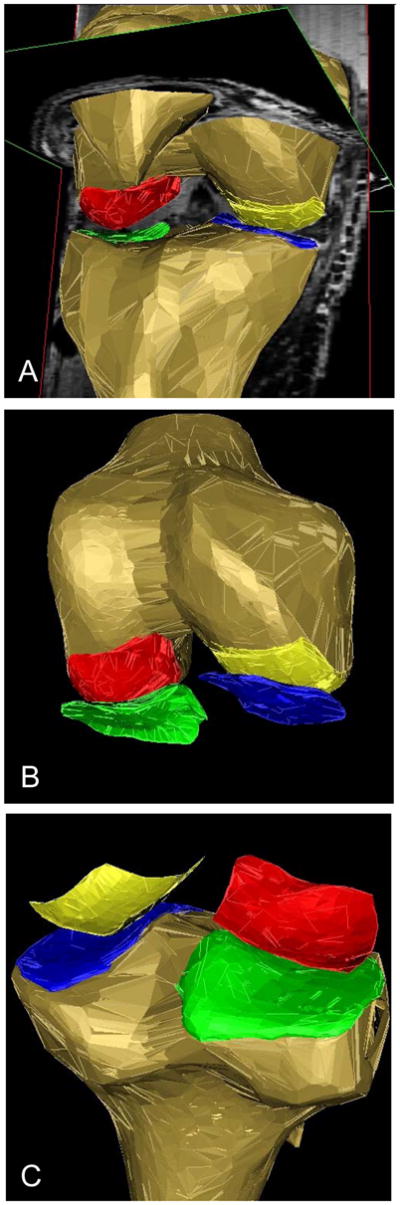
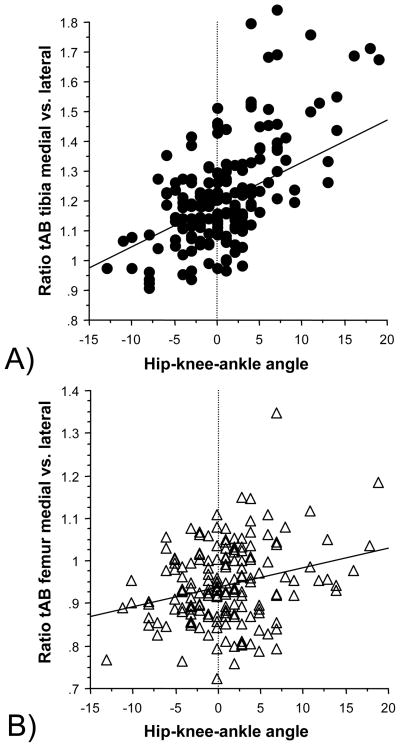
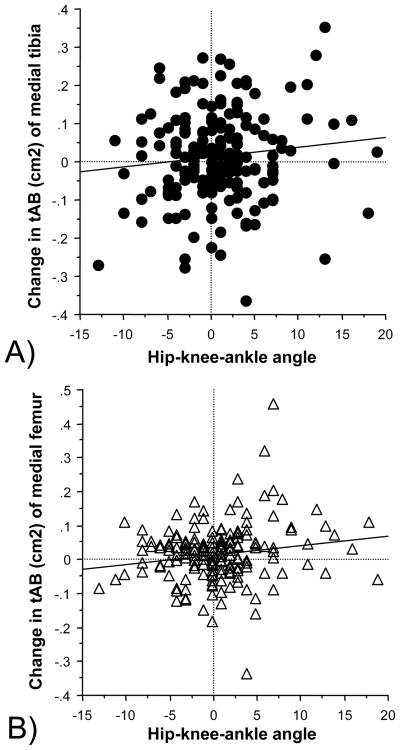
Malalignment is known to affect the medial-to-lateral load distribution in the tibiofemoral joint. In this longitudinal study, we test the hypothesis that subchondral bone surface areas functionally adapt to the load distribution in malaligned knees. Alignment (hip-knee-ankle angle) was measured from full limb films in 174 participants with knee osteoarthritis. Coronal magnetic resonance images were acquired at baseline and 26.6 +/- 5.4 months later. The subchondral bone surface area of the weight-bearing tibiofemoral cartilages was segmented, with readers blinded to the order of acquisition. The size of the subchondral bone surface areas was computed after triangulation by proprietary software. The hip-knee-ankle angle showed a significant correlation with the tibial (r (2) = 0.25, P < 0.0001) and femoral (r (2) = 0.07, P < 0.001) ratio of medial-to-lateral subchondral bone surface area. In the tibia, the ratio was significantly different between varus (1.28:1), neutral (1.18:1), and valgus (1.13:1) knees (analysis of variance [ANOVA]; P < 0.00001). Similar observations were made in the weight-bearing femur (0.94:1 in neutral, 0.97.1 in varus, 0.91:1 in valgus knees; ANOVA P = 0.018). The annualized longitudinal increase in subchondral bone surface area was significant (P < 0.05) in the medial tibia (+0.13%), medial femur (+0.26%), and lateral tibia (+0.19%). In the medial femur, the change between baseline and follow-up was significantly different (ANOVA; P = 0.020) between neutral, varus, and valgus knees, with the increase in surface area being significantly greater (P = 0.019) in varus than in neutral knees. Tibiofemoral subchondral bone surface areas are shown to be functionally adapted to the medial-to-lateral load distribution. The longitudinal findings indicate that this adaptational process may continue to take place at advanced age.
Figures
Comment in
-
Periprosthetic tibial bone mineral density changes after total knee arthroplasty.Acta Orthop. 2016 Jun;87(3):268-73. doi: 10.3109/17453674.2016.1173982. Epub 2016 Apr 27. Acta Orthop. 2016. PMID: 27120266 Free PMC article.
References
-
- Andriacchi TP. Dynamics of knee malalignment. Orthop Clin North Am. 1994;25:395–403. - PubMed
-
- Booth FW. Terrestrial applications of bone and muscle research in microgravity. Adv Space Res. 1994;14:373–376. - PubMed
-
- Brouwer GM, van Tol AW, Bergink AP, Belo JN, Bernsen RM, Reijman M, Pols HA, Bierma-Zeinstra SM. Association between valgus and varus alignment and the development and progression of radiographic osteoarthritis of the knee. Arthritis Rheum. 2007;56:1204–1211. - PubMed
-
- Buckland-Wright C. Protocols for precise radio-anatomical positioning of the tibiofemoral and patellofemoral compartments of the knee. Osteoarthritis Cartilage. 1995;3(Suppl A):71–80. - PubMed
-
- Burgkart R, Glaser C, Hinterwimmer S, Hudelmaier M, Englmeier KH, Reiser M, Eckstein F. Feasibility of T and Z scores from magnetic resonance imaging data for quantification of cartilage loss in osteoarthritis. Arthritis Rheum. 2003;48:2829–2835. - PubMed
Publication types
MeSH terms
Grants and funding
LinkOut - more resources
Full Text Sources
