

Mass spectrometric imaging of lipids using desorption electrospray ionization
- PMID: 19150258
- PMCID: PMC2921711
- DOI: 10.1016/j.jchromb.2008.12.058
Mass spectrometric imaging of lipids using desorption electrospray ionization
Abstract
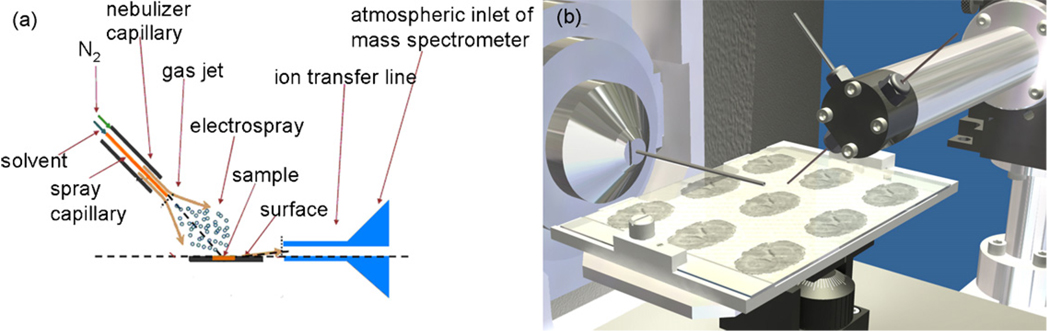
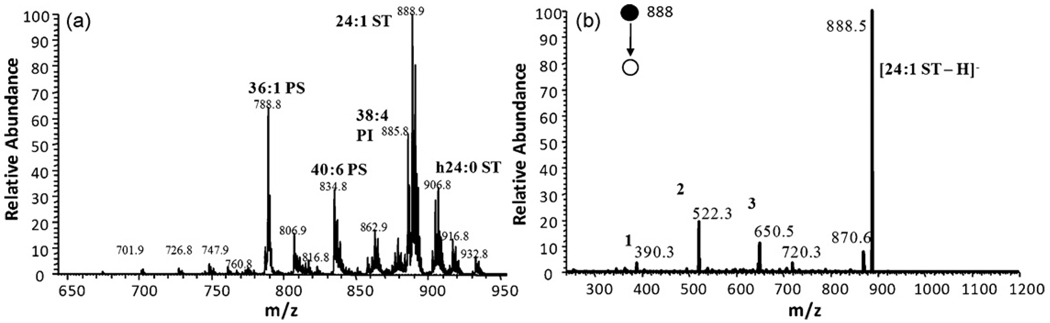
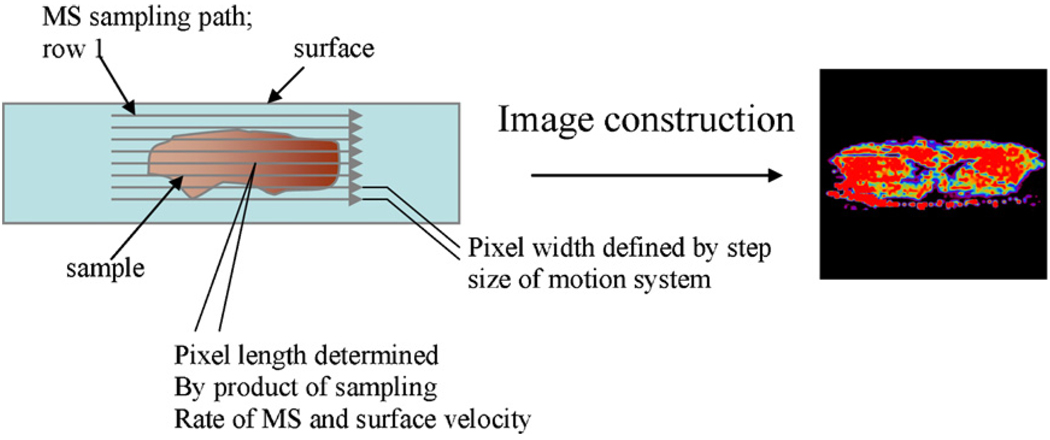
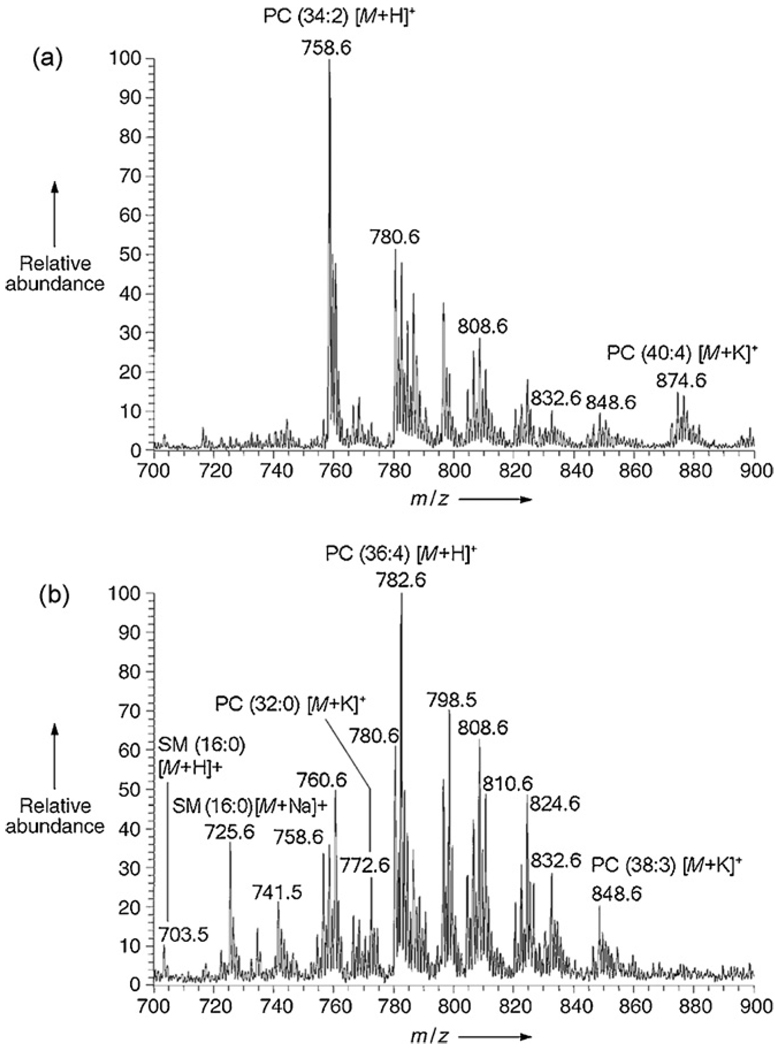
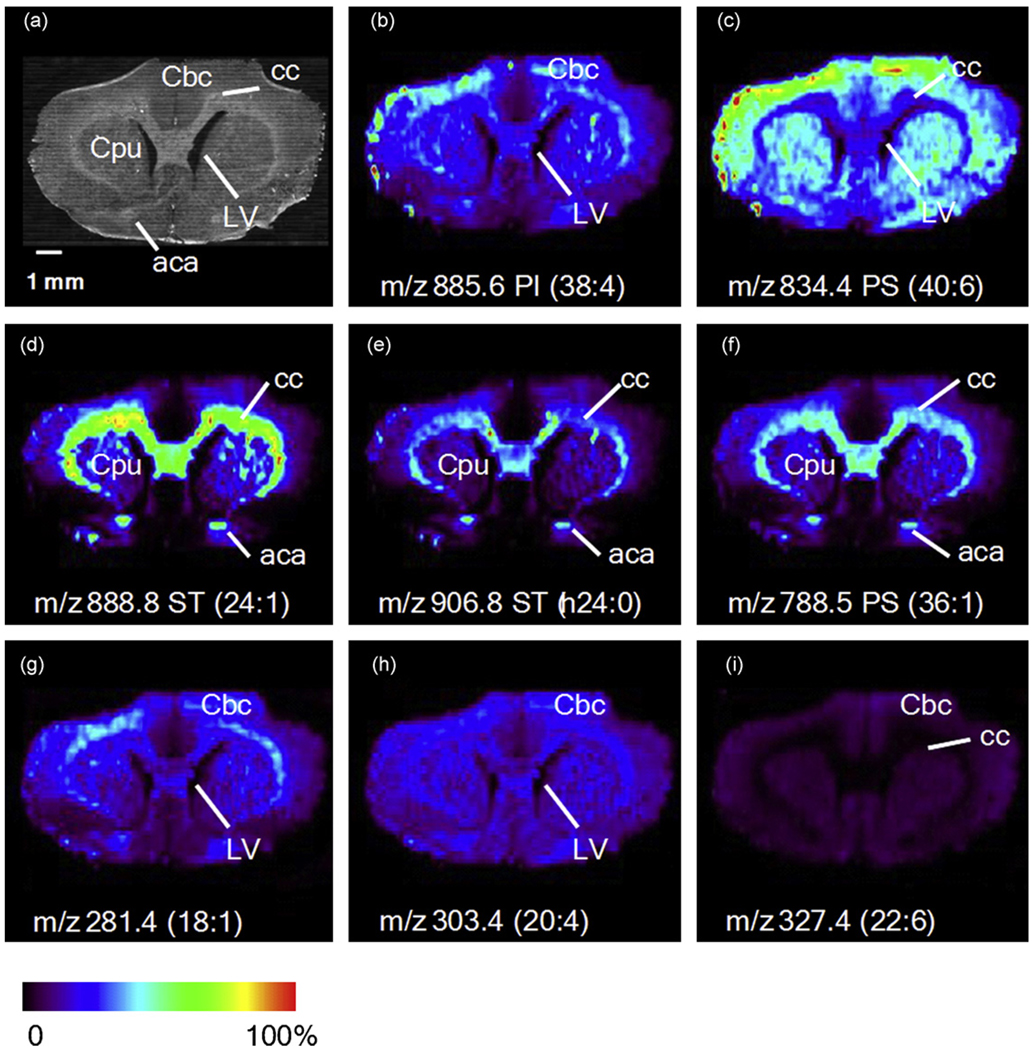
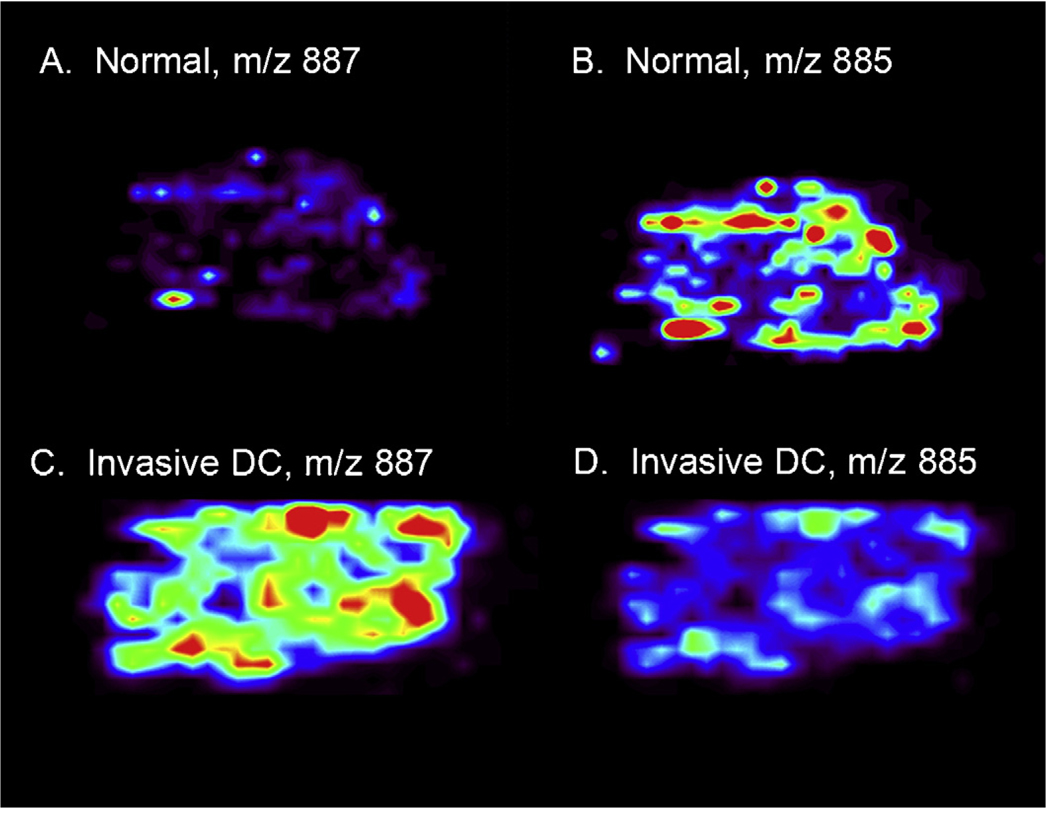
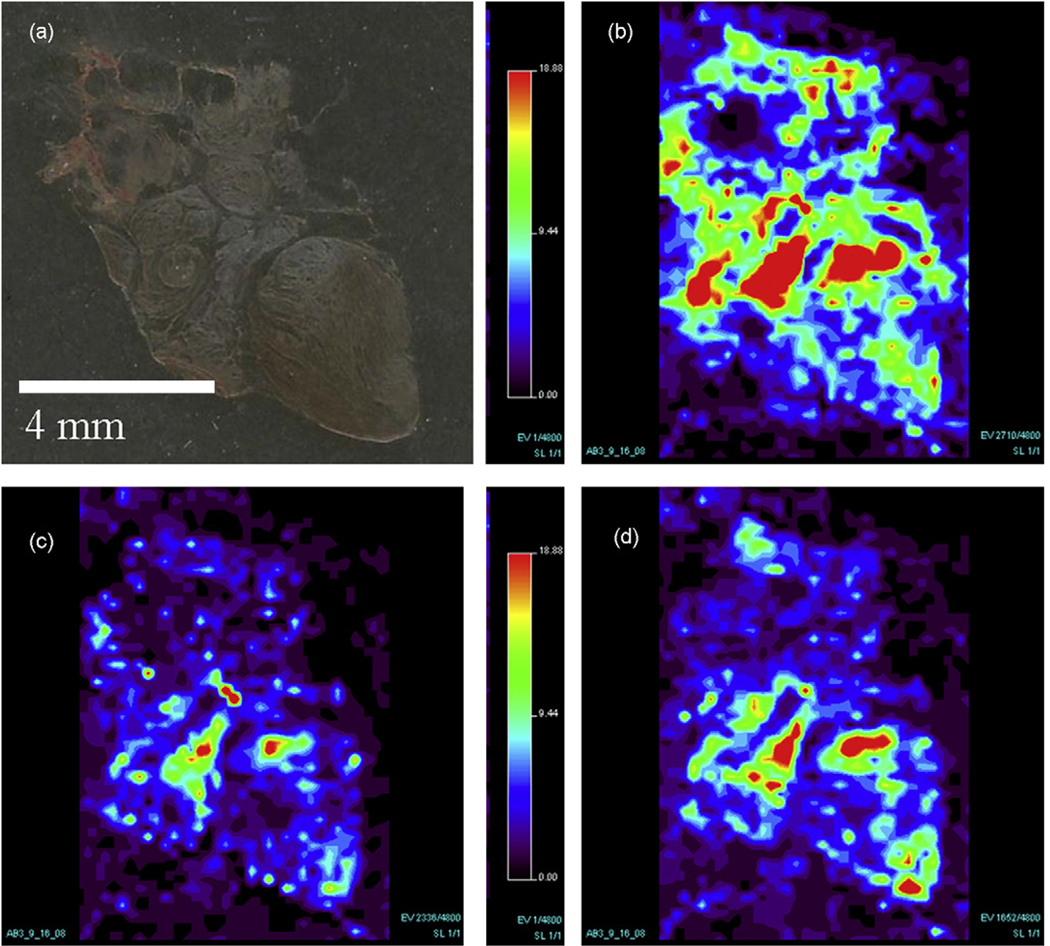
Desorption electrospray ionization (DESI), a relatively new ambient ionization technique used in mass spectrometry (MS), allows for the direct analysis of samples such as thin tissue sections, to be conducted outside of vacuum in the ambient environment and often without sample preparation. DESI-MS has been used in order to systematically characterize phospholipids, which are abundant species in biological tissue samples. Lipids play important biological roles and differences in lipid compositions have been seen in diseases such as cancer and Alzheimer's disease. Imaging of thin tissue sections exploits the ability of DESI-MS to study these lipids directly in the biological matrix. In imaging MS (IMS), a mass spectrum is recorded at each pixel while moving the surface containing the sample so that the entire sample area is covered. The information in these mass spectra can be combined to create a 2D chemical image of the sample, combining information on spatial distribution with information on chemical identity from the characteristic ions in the mass spectra. DESI-MS has been used to image a variety of tissue samples including human liver adenocarcinoma, rat brain, human breast tissue and canine abdominal tumor tissue. Comparisons between diseased and normal tissue are made in these studies.
Figures
Similar articles
-
Enhanced capabilities for imaging gangliosides in murine brain with matrix-assisted laser desorption/ionization and desorption electrospray ionization mass spectrometry coupled to ion mobility separation.Methods. 2016 Jul 15;104:69-78. doi: 10.1016/j.ymeth.2016.02.014. Epub 2016 Feb 23. Methods. 2016. PMID: 26922843
-
Analysis of colorectal adenocarcinoma tissue by desorption electrospray ionization mass spectrometric imaging.Anal Bioanal Chem. 2012 Jun;403(8):2315-25. doi: 10.1007/s00216-012-5841-x. Epub 2012 Mar 25. Anal Bioanal Chem. 2012. PMID: 22447214
-
DESI Mass Spectrometry Imaging (MSI).Methods Mol Biol. 2017;1618:65-75. doi: 10.1007/978-1-4939-7051-3_7. Methods Mol Biol. 2017. PMID: 28523500
-
Desorption electrospray ionization mass spectrometry for lipid characterization and biological tissue imaging.Biochim Biophys Acta. 2011 Nov;1811(11):946-60. doi: 10.1016/j.bbalip.2011.05.006. Epub 2011 May 27. Biochim Biophys Acta. 2011. PMID: 21645635 Free PMC article. Review.
-
[Progress in applications of ambient ionization mass spectrometry for lipids identification].Se Pu. 2025 Jan;43(1):22-32. doi: 10.3724/SP.J.1123.2024.06007. Se Pu. 2025. PMID: 39722618 Free PMC article. Review. Chinese.
Cited by
-
Optimized Mass Spectrometry Analysis Workflow with Polarimetric Guidance for ex vivo and in situ Sampling of Biological Tissues.Sci Rep. 2017 Mar 28;7(1):468. doi: 10.1038/s41598-017-00272-y. Sci Rep. 2017. PMID: 28352074 Free PMC article.
-
Ambient Ionization Mass Spectrometry for Cancer Diagnosis and Surgical Margin Evaluation.Clin Chem. 2016 Jan;62(1):111-23. doi: 10.1373/clinchem.2014.237172. Epub 2015 Nov 10. Clin Chem. 2016. PMID: 26555455 Free PMC article. Review.
-
Lipid imaging with time-of-flight secondary ion mass spectrometry (ToF-SIMS).Biochim Biophys Acta. 2011 Nov;1811(11):976-90. doi: 10.1016/j.bbalip.2011.05.007. Epub 2011 May 27. Biochim Biophys Acta. 2011. PMID: 21664291 Free PMC article. Review.
-
Visualizing spatial lipid distribution in porcine lens by MALDI imaging high-resolution mass spectrometry.J Lipid Res. 2010 Aug;51(8):2295-302. doi: 10.1194/jlr.M005488. Epub 2010 Apr 13. J Lipid Res. 2010. PMID: 20388918 Free PMC article.
-
Visualization of lipid droplet composition by direct organelle mass spectrometry.J Biol Chem. 2011 Feb 4;286(5):3298-306. doi: 10.1074/jbc.M110.186353. Epub 2010 Nov 30. J Biol Chem. 2011. PMID: 21118810 Free PMC article.
References
-
- Watson AD. J. Lipid Res. 2006;47:2101. - PubMed
-
- Vance DE, Vance JE. Biochemistry of Lipids, Lipoproteins and Membranes. New York: Elsevier; 2002.
-
- Montine TJ, Neely MD, Quinn JF, Beal MF, Markesbery WR, Roberts LJ, Morrow JD. Free Radic. Biol. Med. 2002;33:620. - PubMed
-
- Athar M. Indian J. Exp. Biol. 2002;40:656. - PubMed
-
- Polidori MC, Pratico D, Savino K, Rokach J, Stahl W, Mecocci P. J. Card. Fail. 2004;10:334. - PubMed
Publication types
MeSH terms
Substances
Grants and funding
LinkOut - more resources
Full Text Sources
Other Literature Sources
