. 2009 Sep 1;162(3):574-88.
doi: 10.1016/j.neuroscience.2008.12.025. Epub 2008 Dec 24.

Embryonic origins of ZebrinII parasagittal stripes and establishment of topographic Purkinje cell projections

Affiliations

Embryonic origins of ZebrinII parasagittal stripes and establishment of topographic Purkinje cell projections

R V Sillitoe et al. Neuroscience. .

Abstract

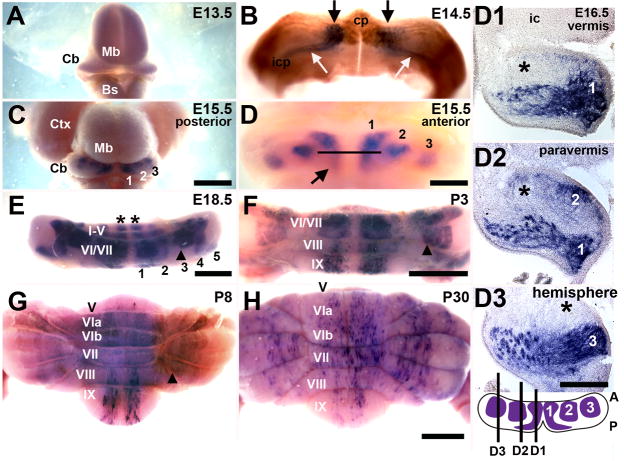
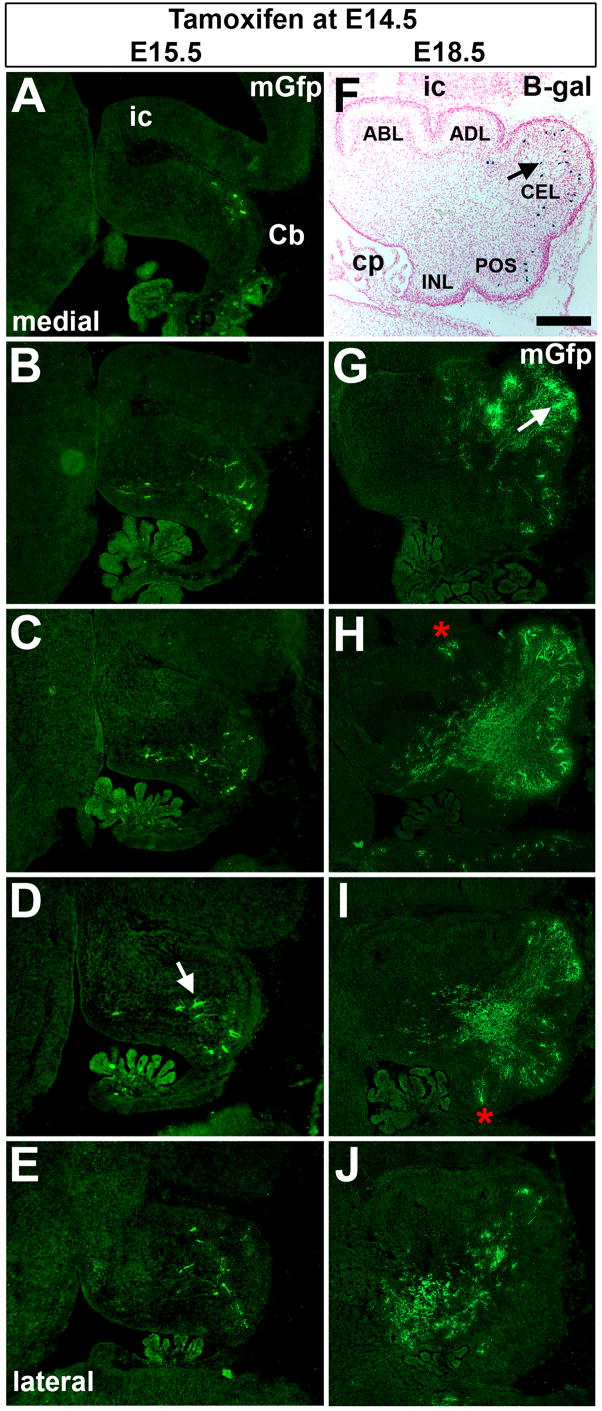
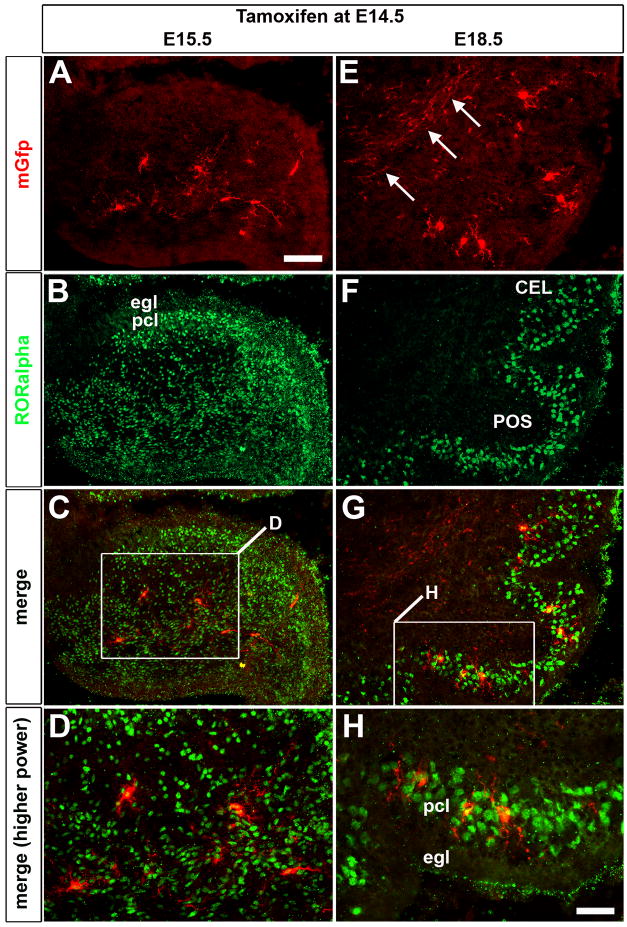
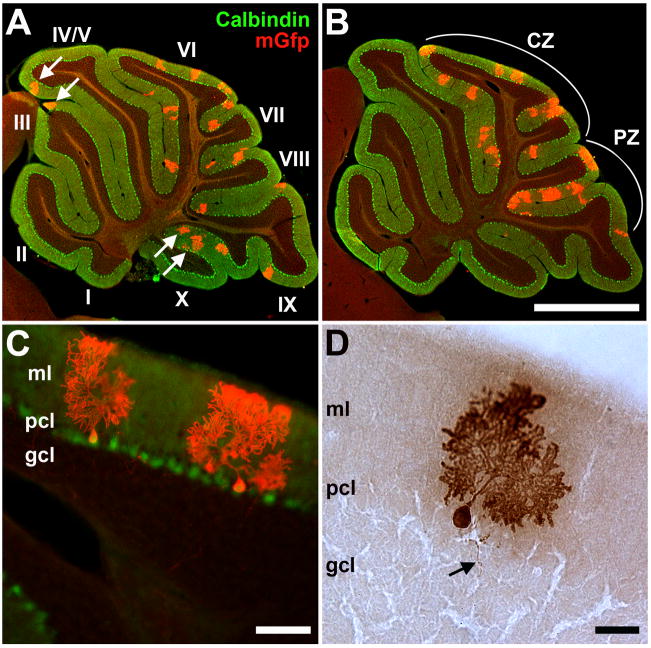
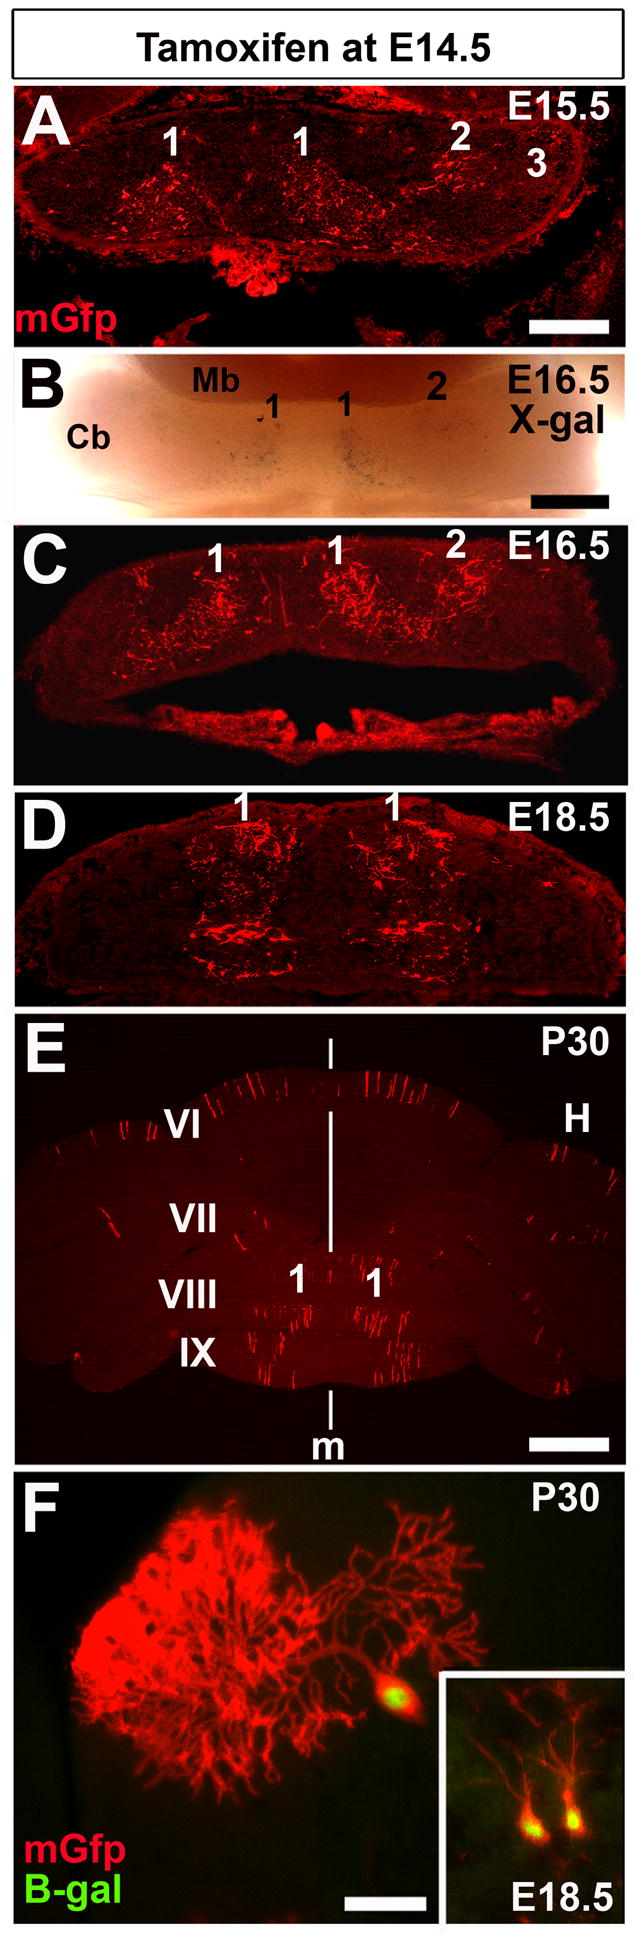
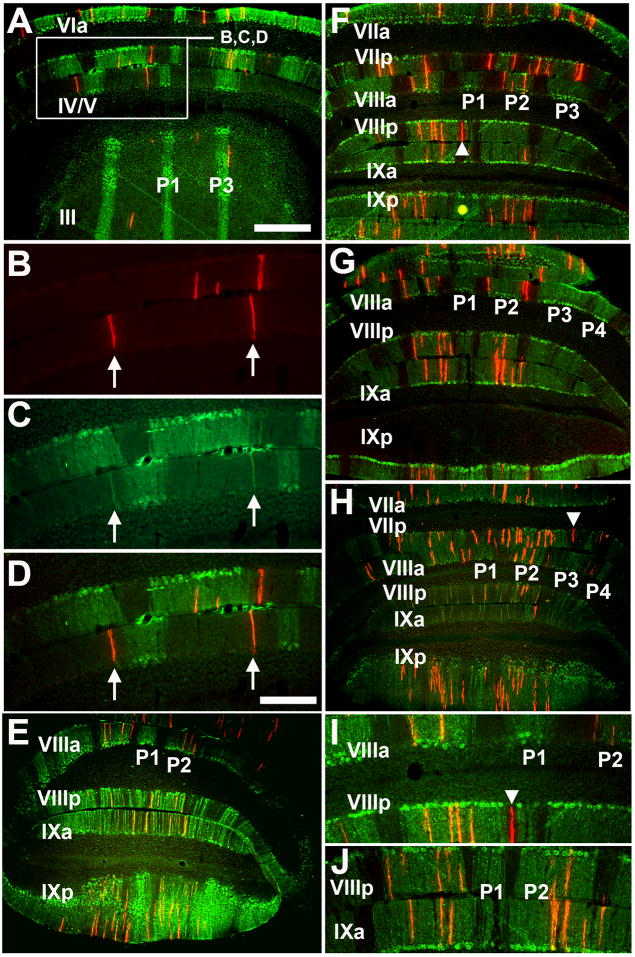
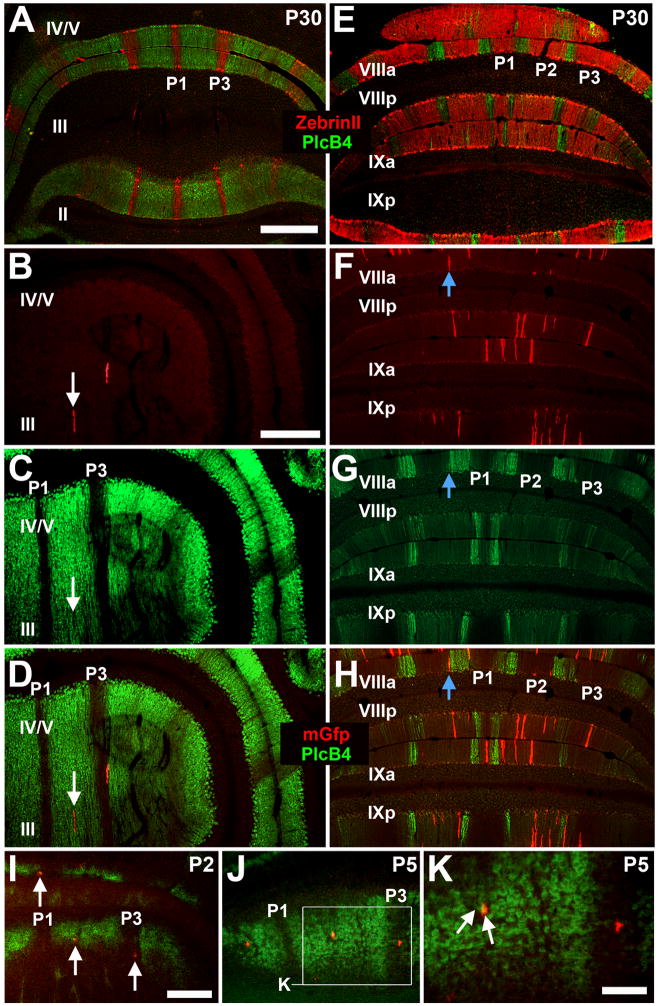
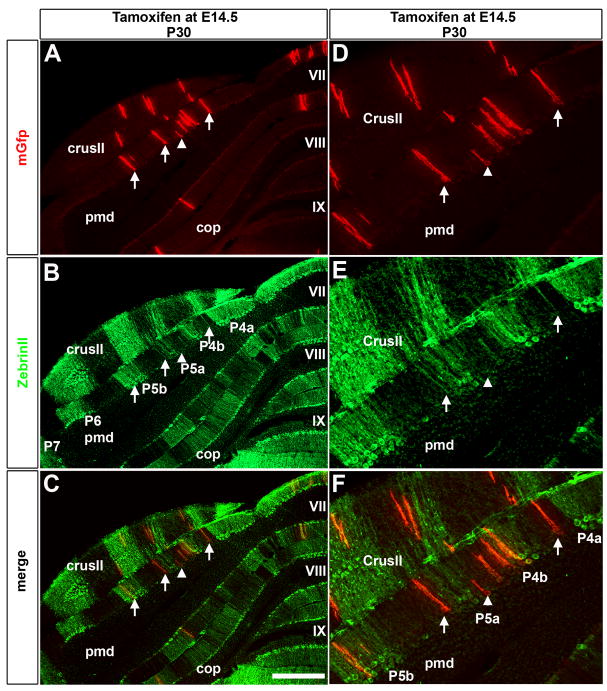
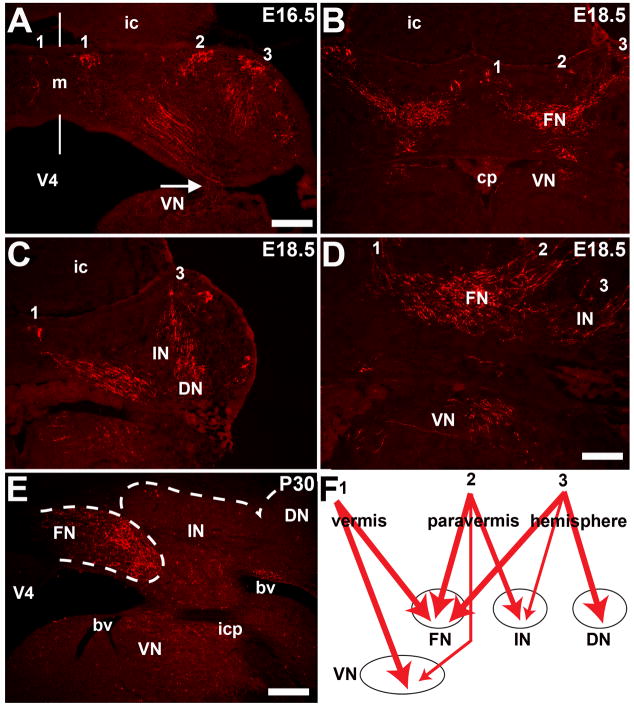
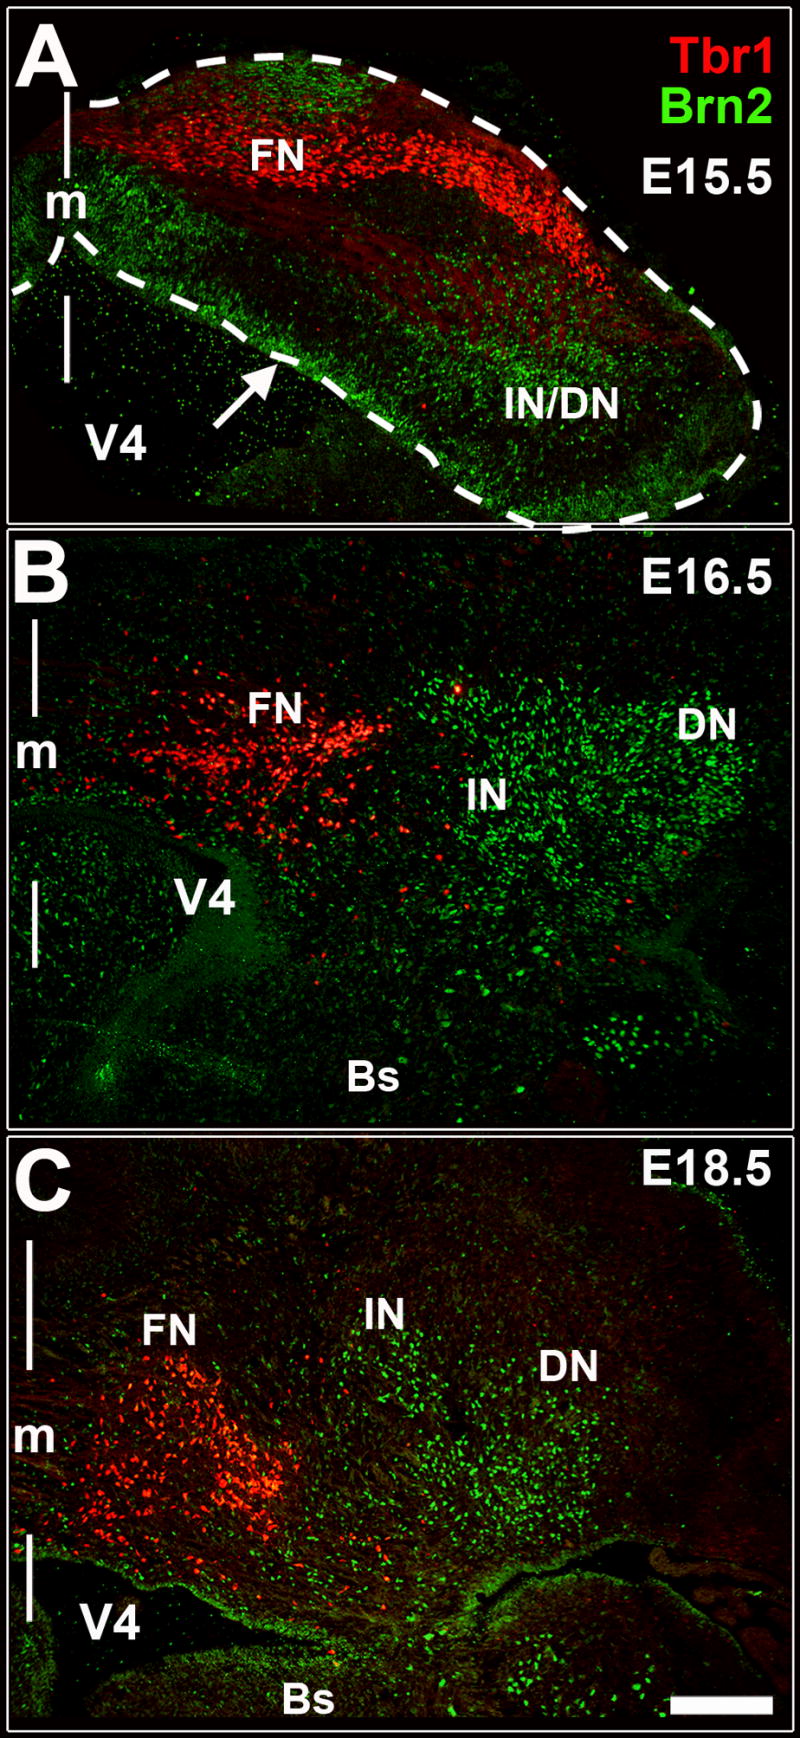
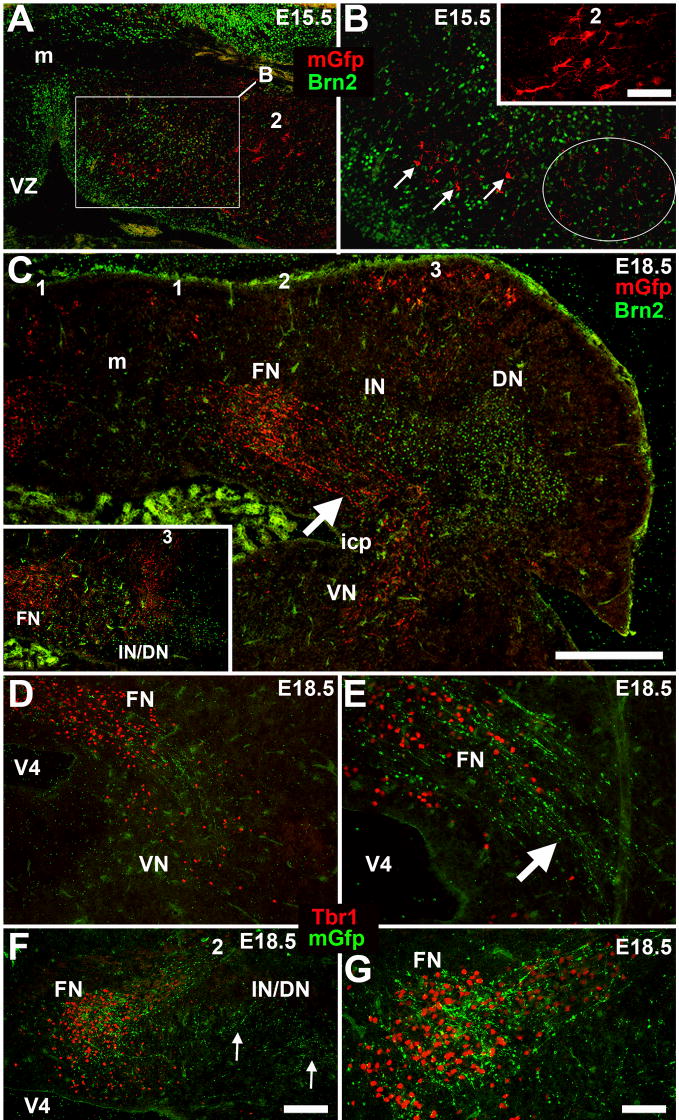
The establishment of neural circuits involves both the precise positioning of cells within brain regions and projection of axons to specific target cells. In the cerebellum (Cb), the medial-lateral (M-L) and anterior-posterior (A-P) position of each Purkinje cell (PC) and the topography of its axon can be defined with respect to two coordinate systems within the Cb; one based on the pattern of lobules and the other on PC gene expression in parasagittal clusters in the embryo (e.g. Pcp2) and stripes in the adult (e.g. ZebrinII). The relationship between the embryonic clusters of molecularly defined PCs and particular adult PC stripes is not clear. Using a mouse genetic inducible fate mapping (GIFM) approach and a Pcp2-CreER-IRES-hAP transgene, we marked three bilateral clusters of PC clusters with myristolated green fluorescent protein (mGfp) on approximately embryonic day (E) 15 and followed their fate into adulthood. We found that these three clusters contributed specifically to ZebrinII-expressing PCs, including nine of the adult stripes. This result suggests that embryonic PCs maintain a particular molecular identity, and that each embryonic cluster can contribute PCs to more than one adult M-L stripe. Each PC projects a primary axon to one of the deep cerebellar nuclei (DCN) or the vestibular nuclei in the brainstem in an organized fashion that relates to the position of the PCs along the M-L axis. We characterized when PC axons from the three M-L clusters acquire topographic projections. Using a combination of GIFM to mark the PC clusters with mGfp and staining for human placental alkaline phosphatase (hAP) in Pcp2-CreER-IRES-hAP transgenic embryos we found that axons from each embryonic PC cluster intermingled with neurons within particular DCN or projected out of the Cb toward the vestibular nuclei by E14.5. These studies show that PC molecular patterning, efferent circuitry, and DCN nucleogenesis occur simultaneously, suggesting a link between these processes.


Figures

Figure 1
Figure 1. hAP staining in Pcp2-CreER-IRES-hAP mice reveals PC stripes throughout development
A, No staining was observed at E13.5 (dorsal view). B, By E14.5 (posterior-inferior view) two distinct M-L clusters were seen on each side of the Cb (black arrows). C, By E15.5 (dorsal view) there are an additional two PC clusters (numbered as 2, 3). D, Anterior view of an E15.5 Cb showing weaker staining in the anterior Cb (below the black horizontal line and black arrow). D1–D3, Tissue sections stained for hAP at E16.5. Numbers indicate PC clusters and asterisks indicate weak staining. In the dorsal view schematic (D3) the black vertical lines indicate the level of where the sagittal tissue sections in D1D3 were taken from. E, F, Between E18.5 to P3 expression within each cluster intensifies and expands anteriorly (asterisks in E) and posteriorly. G, M-L stripes were seen By P8. Lobules VI-VII were uniformly stained. H, Stripe boundaries were poorly delineated in the adult. Lobules are indicated by Roman numerals (applies to all figures). Abbreviations: Bs, brainstem; Cb, cerebellum; Cp, choroid plexus; Ctx, cerebral cortex; icp, inferior cerebellar peduncle; Mb, midbrain; A, anterior; P, posterior. Scale bar in C = 1mm (also applies to A), D = 500 μm (also applies to B), D3 = 250 μm, E = 500 μm, F = 1 mm, H = 1 mm.
Figure 2
Figure 2. Pcp2 expressing PCs are located within specific A-P locations during embryogenesis
A–J, Mice treated with tamoxifen at E14.5 and analyzed using mGfp on sagittal sections at E15.5 and E18.5. By E18.5 most PCs were located at the periphery of the Cb cortex. A few were located internally (arrow in G; see also Fig. 3). The red asterisks in H and I indicate marked cells in the ADL and INL, respectively. Abbreviations: ABL, anterobasal lobe, ADL, anterodorsal lobe; CEL, central lobe; POS, posterior lobe; INL, inferior lobe; B-gal, B-galactosidase; Cb, cerebellum; cp, choroid plexus; ic, inferior colliculus; mGfp, myristolated Green fluorescent protein. Scale bar in F = 250 μm (applies to all panels).
Figure 3
Figure 3. PCs are selectively marked in Pcp2-CreER-IRES-hAP;TaumGfp/+ mice
A–H, Mice treated with tamoxifen at E14.5 and analyzed on sagittal sections at E15.5 and E18.5. mGfp expression (red) showing that all transgene expressing cells were RORα positive (green) PCs. mGfp expression revealed PC somata and processes. The regions outline by boxes in C and G are shown at higher power in D and H. Abbreviations: egl, external granular layer; pcl, developing Purkinje cell layer, CEL, central lobe; POS, posterior lobe. The scale bar in A = 125 μm (applies to B, C, E, F, G), H = 62.5 μm (applies to D).
Figure 4
Figure 4. Pcp2 expressing PCs preserve their A-P locations during development
A, B, Mice treated with tamoxifen at E14.5 and analyzed by mGfp expression (red) and Calbindin (green) on sagittal sections at P30. C, D, higher power magnification of marked PCs. The arrow in D points to an axon. Abbreviations: CZ, central zone; PZ, posterior zone; ml, molecular layer; pcl, Purkinje cell layer; gcl, granule cell layer. The scale bar in B = 1 mm (applies to A), C = 125 μm, D = 50 μm.
Figure 5
Figure 5. Pcp2 expressing PCs are located within specific M-L clusters
A–F, Mice treated with tamoxifen at E14.5 and analyzed on coronal sections at E15.5, E16.5, E18.5, and P30. mGfp expression (red) showing that marked PCs were located mainly within three distinct M-L clusters. B, Whole mount staining for X-gal at E16.5. Clusters 1 and 2 have the highest number of marked PCs. F, mGfp and B-gal double stained PCs at P30. Abbreviations: B-gal, B-galactosidase; H, hemisphere; hAP, human placental Alkaline phosphatase; mGfp, myristolated Green fluorescent protein. Scale bars in A = 250 μm (applies to C, E, D, F), B = 500 μm, G = 500 μm, H = 50 μm.
Figure 6
Figure 6. Pcp2 expressing PCs are restricted to ZebrinII stripes in the vermis
A, Mice treated with tamoxifen at E14.5 and analyzed on coronal sections at P30 using mGfp expression (red) showing that marked PCs in the AZ co-labeled with ZebrinII (green). The area outlined by the box in A is shown at higher power in BC. Marked PCs located within ZebrinII “negative” stripes expressed mGfp and ZebrinII (arrows in B–D). EH illustrates the restriction of marked PCs to ZebrinII positive stripes in the PZ (three different animals). The higher power images in I and J were taken from different animals and illustrate the predominance of mGfp marked cells within ZebrinII positive stripes. Occasional mGfp positive/ZebrinII negative PCs were located within ZebrinII negative stripes (arrowheads in F, H, I). Scale bar in A = 500 μm (applies to EH), D = 250 μm (applies to B, C, I, J).
Figure 7
Figure 7. Pcp2 expressing PCs are located within complementary stripes to Plcβ4
A, E, ZebrinII and Plcβ4 have complementary stripe patterns in the AZ (A) and PZ (E). Mice treated with tamoxifen at E14.5 and analyzed on coronal sections at P30 showing that mGfp (red) marked PCs are Plcβ4 (green) negative in the AZ (B–D) and PZ (F–H). A few marked cells were found within the Plcβ4 positive stripes (arrows in B–C) and some appeared to co-express mGfp and Plcβ4 (blue arrows in F–H). At P2 (I) and P5 (J, K) most AZ PCs did not express Plcβ4 (lateral arrows in I and right arrow in K). A few did co-express mGfp (middle arrow in I) or were closely adjacent to PCs expressing mGfp (left arrow in K). The area outline by the box in J is shown at higher power in K. Scale bar in A = 750 μm (applies to E), B = 500 μm (applies to C, D, F, G, H), I = 250 μm (applies to J), K = 100 μm.
Figure 8
Figure 8. Pcp2 expressing PCs are restricted to ZebrinII stripes in the hemispheres
Mice treated with tamoxifen at E14.5 and analyzed on coronal sections at P30 using mGfp expression (red, A, C) showed that marked cells were co-labeled with ZebrinII (green, B, C). Arrows point to examples of double labeled PCs. DF are higher power images of CrusII and the pmd illustrating the restriction of mGfp marked cells to ZebrinII positive stripes. Abbreviations: pmd, paramedian lobule; cop, copula pyramidis. Scale bar in C = 500 μm (A–C) and 250 μm (D–F).
Figure 9
Figure 9. PC axons are restricted to M-L locations in the Cb
Mice treated with tamoxifen at E14.5 and analyzed on coronal sections at E16.5 (A), E18.5 (B–D) and P30 (E) using mGfp expression (red). PCs clusters are labeled as 1–3. The DCN in E are outlined with dotted lines. F, Schematic illustrating axon contributions of each PC cluster to the DCN and VN. Thicker arrows represent larger contributions. Abbreviations: V4, fourth ventricle; icp; inferior cerebellar peduncle; ic, inferior colliculus; cp, choroid plexus; FN, fastigial nucleus; IN, interposed nucleus; DN, dentate nucleus; VN, vestibular nucleus; bv, blood vessel, m, midline of Cb. Scale bar in A = 250 μm (applies to B, C), D = 125 μm, E = 250 μm.
Figure 10
Figure 10. Tbr1 is expressed in the fastigial nucleus and Brn2 is expressed in the interposed and dentate nuclei
Coronal cut sections through E15.5 (A), E16.5 (B), and E18.5 (C) Cb showing that Tbr1 (red) is mainly expressed in neurons of FN while Brn2 (green) is mainly expressed in neurons of the IN and DN. The E15.5 Cb is outlined with a dotted line. The arrow in A points to the ventricular zone. Abbreviations: V4, fourth ventricle; FN, fastigial nucleus; IN, interposed nucleus; DN, dentate nucleus; VN, vestibular nucleus, Bs, brainstem, m, midline of Cb. Scale bar in C = 100 μm (applies to A, B).
Figure 11
Figure 11. Pcp2 expressing PCs project axons to topographical locations within the DCN and vestibular nuclei
Mice were treated with tamoxifen at E14.5 and analyzed on coronal sections at E15.5 (A, B), and E18.5 (C–G) using mGfp expression (red) and either Tbr1 or Brn2. By E15.5 mGfp marked PC somata (asterisk in A, arrows in B) and their axons (circled region in B) are intermingled with Brn2 expressing neurons (green). Inset in B, The cluster of PCs labeled as #2 is from a near adjacent section compared to panel A. The area outlined by the box in A is shown at higher power in B. Abbreviations: V4, fourth ventricle; FN, fastigial nucleus; icp, inferior cerebellar peduncle; IN, interposed nucleus; DN, dentate nucleus; VN, vestibular nucleus; VZ, ventricular zone; m, midline of Cb. Scale bar in C = 250 μm (applies to A and is = 500 μm for the inset in C), the inset in B = 50 μm, F = 100 μm (applies to B, D), G = 50 μm (applies to E).

Similar articles

Cited by

References

    1. Adamantidis AR, Zhang F, Aravanis AM, Deisseroth K, de Lecea L. Neural substrates of awakening probed with optogenetic control of hypocretin neurons. Nature. 2007;450:420–424. - PMC - PubMed
    1. Ahn AH, Dziennis S, Hawkes R, Herrup K. The cloning of zebrin II reveals its identity with aldolase C. Development. 1994;120:2081–2090. - PubMed
    1. Altman J, Bayer SA. Development of the Cerebellar System in Relation to its Evolution, Structure, and Functions. Boca Raton: CRC Press; 1997. p. 783.
    1. Armstrong CL, Krueger AM, Currie RW, Hawkes R. Constitutive expression of the 25 kDa heat shock protein Hsp25 reveals novel parasagittal stripes of Purkinje cells in the adult mouse cerebellar cortex. J Comp Neurol. 2000;416:383–397. - PubMed
    1. Armstrong CL, Krueger-Naug AM, Currie RW, Hawkes R. Expression of heat-shock protein Hsp25 in mouse Purkinje cells during development reveals novel features of cerebellar compartmentation. J Comp Neurol. 2001;429:7–21. - PubMed

Publication types

MeSH terms