. 2009 Apr;85(4):627-37.
doi: 10.1189/jlb.1008668. Epub 2009 Jan 15.

Polymerization of actin does not regulate desensitization in human basophils

Affiliations

Polymerization of actin does not regulate desensitization in human basophils

Donald MacGlashan Jr et al. J Leukoc Biol. 2009 Apr.

Abstract

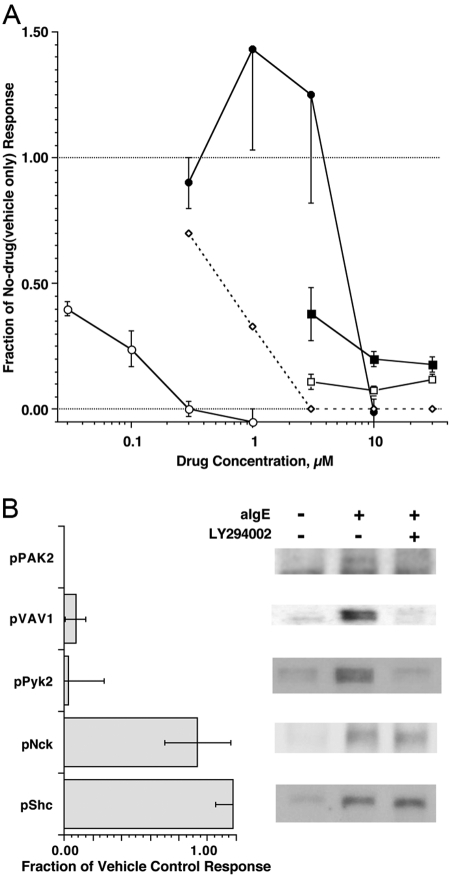
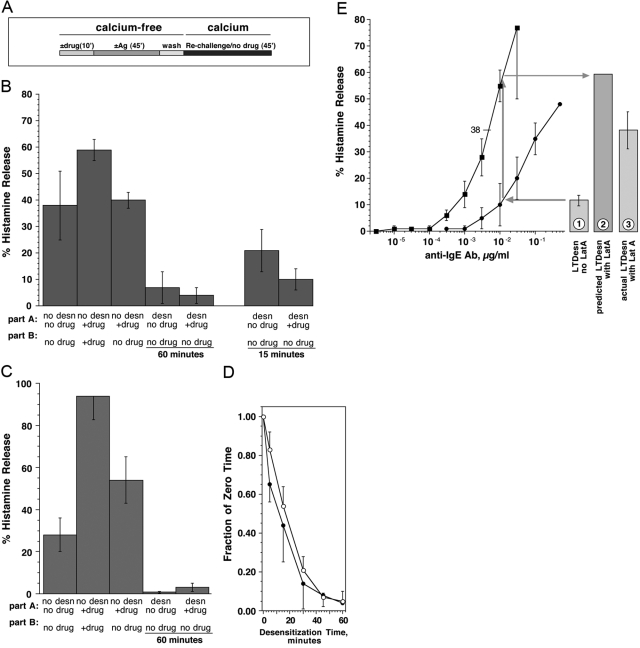
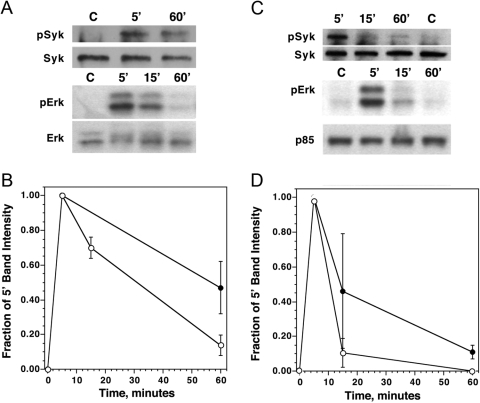
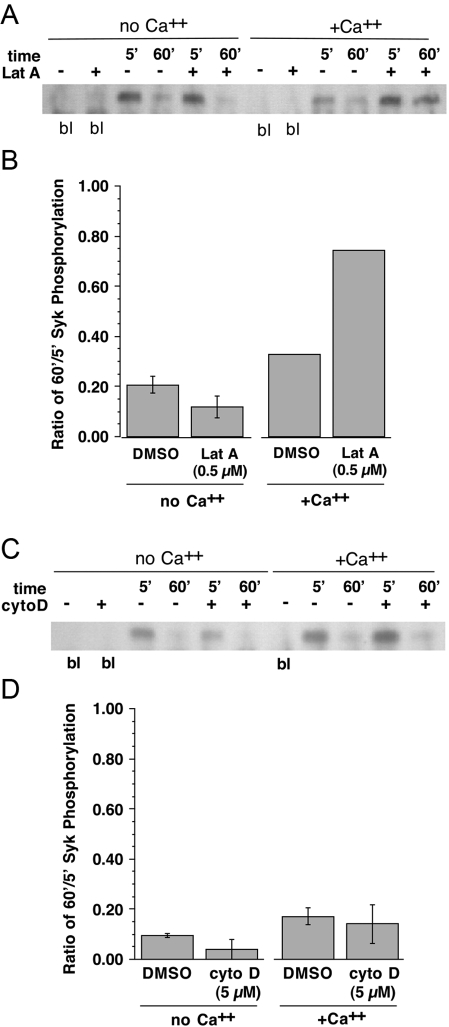
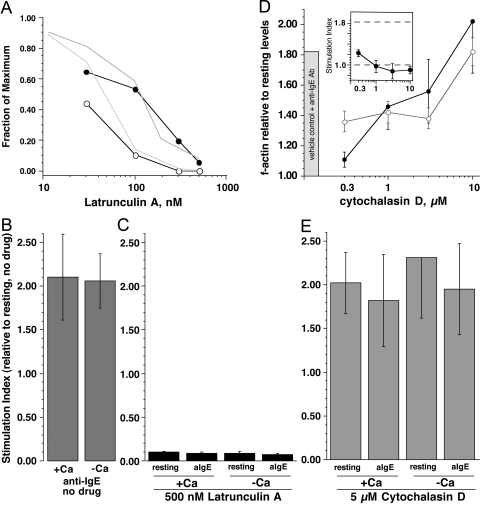
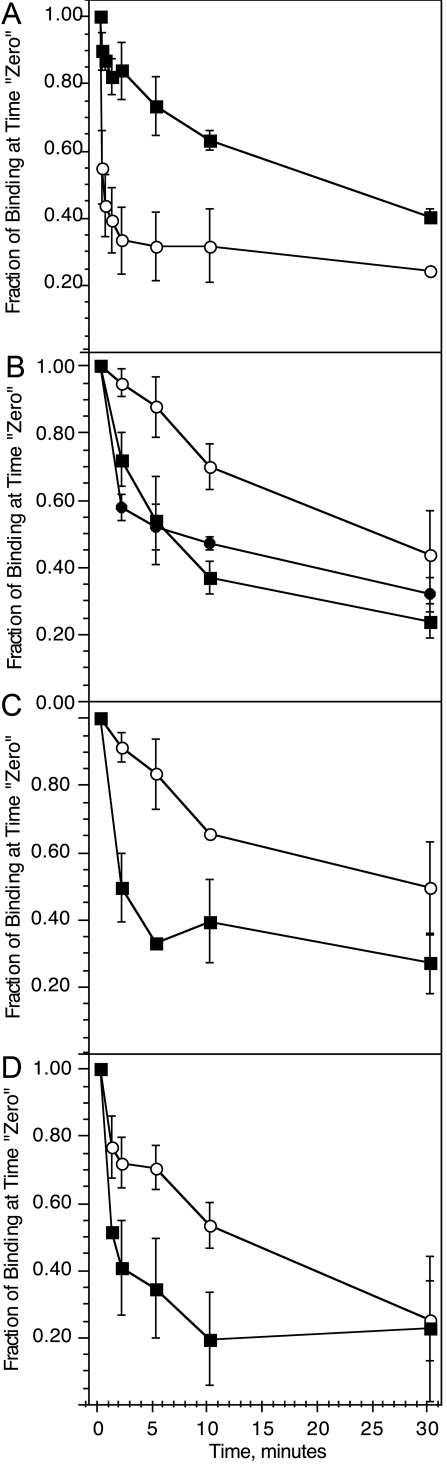
Previous studies have suggested that maintenance of IgE-mediated signaling results from regulation of the activity of signaling complexes by actin polymerization. This process is also hypothesized to be related to desensitization of basophils and mast cells. Recent studies demonstrated that any signaling process dependent on syk or PI-3K activity cannot be a mechanism of desensitization, and in this context, syk and PI-3K inhibitors were found to inhibit actin polymerization. Inhibitors of actin polymerization were tested for their effect on desensitization of human peripheral blood basophils. Latrunculin A, in particular, removed all resting and stimulated f-actin but did not inhibit desensitization. Cytochalasin D and latrunculin A also did not reverse the loss of syk phosphorylation that accompanies desensitization. These results demonstrate that desensitization mechanisms are not dependent on actin polymerization. In this context, it was also shown that progressive immobilization of Fc epsilon RI during aggregation was sensitive to syk or actin polymerization inhibition. Therefore, desensitization is also not dependent on receptor immobilization. These studies demonstrate that desensitization is not the result of two signaling pathways once considered relevant to down-regulation of IgE-mediated signaling.


Figures

Fig. 1.
Fig. 1.
Inhibition of actin polymerization and the actin polymerization signaling pathway with early signaling inhibitors. (A) Inhibition of the anti-IgE antibody-stimulated f-actin increase with (○) NVP-QAB205 with anti-IgE antibody as a stimulus (0.2 μg/ml; n=2), (•) PP1 with anti-IgE antibody as a stimulus (0.2 μg/ml; n=2), (□) LY294002 with BPO-HSA (0.5 μg/ml) as a stimulus (n=5), (▪) LY294002 with anti-IgE antibody (0.2 μg/ml) as a stimulus (n=5). Inhibition of Akt phosphorylation (⋄, dotted line) with LY294002 and anti-IgE antibody as the stimulus (derived from ref. [32]). The dotted, horizontal lines show the resting and stimulated levels of response in the presence of the vehicle control. (B) Effect of LY294002 on stimulated phosphorylation of several components thought to be in the pathway that mediates actin polymerization. Basophils were stimulated with anti-IgE antibody (0.2 μg/ml) for 5 min in the presence or absence of 10 μM LY294002 or vehicle control. For phospho-VAV1 (pVAV1), pPAK2, pPyk2, and pShc, the cells were lysed in hot electrophoresis sample buffer, and for pNck, the cells were lysed in CLB, and lysates immunoadsorbed with antiphosphotyrosine antibody (PY20) and the Western blot developed with anti-Nck antibody. The left histogram shows the average results for three experiments each, and the right side shows an example of Western blots. (The band for PAK2 is very faint and difficult to image for the figure but is readily digitized for quantitative analysis.)
Fig. 2.
Fig. 2.
Desensitization of basophils in the presence or absence of cytochalasin B or latrunculin A. (A) Schematic of the protocol for performing the desensitization ± drug (see Materials and Methods). (B; n=4) Desensitization (desn) ± 5 μM cytochalasin B. Drug or vehicle control (DMSO) at an equivalent concentration was included in the desensitization phase of (stimulation without Cae, 50 μM EDTA) the experiment. The cells were stimulated with anti-IgE antibody. The first two columns show the controls that demonstrate the efficacy of cytochalasin B to enhance histamine release when present (Column 2 vs. Column 1). Column 3 shows that the drug present during the desensitization phase (no stimulus present) was washed away effectively during the wash step preceding stimulation in the second phase of the protocol (Column 3 vs. Column 1). Column 4 shows the responsiveness of the cells after 60 min of desensitization with vehicle control, and Column 5 shows desensitization with cytochalasin B present in the first phase (both columns under-labeled with “60 minutes”). The last two columns show data similar to Columns 4 and 5 but stopping the desensitization phase at 15 min. (C; n=3) The design is similar to that shown in B, except that 500 nM latrunculin A was used. The period of desensitization was 60 min. (D; n=3) Kinetics of desensitization ± 500 nM latrunculin A in the desensitization phase and the release phase. Histamine release in the vehicle control cells (at 0 min of desensitization) was 36 ± 16% and in the latrunculin A-treated cells (at 0 min of desensitization) was 73 ± 11%. (E; n=3) Subthreshold desensitization ± 200 nM latrunculin A (LTDesn). The left plot shows histamine release ± latrunculin A for 260 min with single concentrations of anti-IgE antibody; without (•) and with (▪) latrunculin A. The histograms on the right show histamine release for basophils stimulated with escalating concentrations of anti-IgE antibody ± latrunculin A (LatA). The concentrations and timing of stimulation were in the absence of latrunculin A (histogram marked 1) 0.0003, 0.001, 0.003, 0.01, 0.03, 0.1 μg/ml for 40, 40, 40, 30, 30, 20 min, followed by 0.5 μg/ml for 30 min. In the presence of 200 nM latrunculin A (histogram marked 3), the concentrations and timing were 0.00003, 0.0001, 0.003, 0.001, 0.03, 0.01, 0.03 μg/ml for 30, 40, 40, 40, 40, 20, 20 min, followed by 0.1 μg/ml for 30 min. The histogram marked “2” is the predicted amount of release for latrunculin A-treated cells (follow arrows) following escalating concentrations of anti-IgE antibody.
Fig. 3.
Fig. 3.
Kinetics of syk or Erk phosphorylation following stimulation in the absence of Cae (50 μM EDTA). To perform these experiments, the cells were treated briefly with lactic acid to remove a fraction of the endogenous IgE, resensitized with penicillin (BPO)-specific IgE on ice (see Materials and Methods), washed, and stimulated with BPO(11)-HSA at 0.5 μg/ml in PAG (+50 μM EGTA) or goat anti-IgE antibody. After the times shown, cells were lysed with electrophoresis sample buffer or CLB and processed for Western blotting (see Materials and Methods). The Western blot bands were digitized, and data are expressed as the fraction of the response observed at 5 min. (A) Example blots for syk and Erk phosphorylation following stimulation with an optimal concentration of anti-IgE antibody, 0.2 μg/ml (C, control). Also shown are the re-blot for lane-loading control. (B) Average kinetics (○) pErk response in cells stimulated with anti-IgE antibody (n=3); (•) syk phosphorylation in cells stimulated with anti-IgE antibody (n=7). (C) Example blots for syk and Erk phosphorylation following stimulation with an optimal concentration of BPO(11)-HSA, 0.5 μg/ml. Also shown are the re-blot for lane loading; p85 was used as a lane-loading control in the pErk example [38]. (D) Average kinetics (○) pErk response in cells stimulated with BPO(11)-HSA (n=2); (•) syk phosphorylation in cells stimulated with BPO(11)-HSA (n=3). Not shown is that the 5-min peak response for syk phosphorylation in the absence of Cae was ∼50% of the peak in the presence of Cae and ∼35% for Erk phosphorylation.
Fig. 4.
Fig. 4.
Syk phosphorylation in the presence and absence of Cae and the presence or absence of latrunculin A or cytochalasin D. (A) Western blot (4G10, antiphosphotyrosine antibody) for one example experiment (the syk re-blot is not shown, but loading was similar for all lanes). The latrunculin A concentration was 0.5 μM (vs. vehicle control, DMSO). bl, no stimulus. (B) Average results for two experiments like that shown in A. (C) An example experiment similar in design to that shown in A; the drug was 5 μM cytochalasin D (cytoD). (D) Average of two experiments as shown in C.
Fig. 5.
Fig. 5.
Polymerization of actin under resting and stimulated conditions ± Cae. (A) Concentration dependence of actin polymerization with latrunculin A at the shown concentrations (n=1). (•) Stimulated increase in f-actin, (○) resting level of f-actin. The light gray lines show data from a previous study, which was done in the presence of Cae [13] (n=3). (B; n=3) Stimulation index of actin polymerization ± Cae; cells were stimulated with 0.5 μg/ml anti-IgE antibody (6061) for 8 min prior to fixation and labeling. (C; n=3) Presence of f-actin in basophils, resting versus stimulated (anti-IgE antibody), ± Cae in the presence of 500 nM latrunculin A. Data are plotted relative to the resting f-actin in cells not treated with drug. (D; n=3) f-Actin in resting (•) or stimulated basophils (anti-IgE antibody; ○) in the presence or absence of cytochalasin D at the concentrations shown. Data are calculated relative to resting cells in the presence of vehicle control (DMSO). The inset shows the stimulation index (anti-IgE vs. resting) for each concentration of cytochalasin D. The upper dotted line at ∼1.8 is the stimulation index with vehicle control. (E; n=3) Stimulation index (relative to resting cells with vehicle control) ± Cae in the presence of 5 μM cytochalasin D.
Fig. 6.
Fig. 6.
Kinetics of DNP-GFP elution from basophils under various conditions. Basophils were sensitized with and without DNP-specific IgE. The nonsensitized cells were used as controls for all of the time-points and conditions shown. Flurorescence was monitored by flow cytometry. Data are expressed as a fraction of the maximum or starting net signal (sensitized–nonsensitized fluorescence). (A; n=5) Kinetics of antigen elution after 5 min of antigen binding (○) or 60 (▪) min of antigen binding; 0.4 mM DNP-lysine was added and the amount of fluorescence monitored for the times shown. (B; n=3) Kinetics of elution in the presence of vehicle control (DMSO; ○), 0.3 μM NVP-QAB205 (•), or 10 μM PP1 (▪). The drugs were present throughout the first 60 min of binding as well as the 30-min elution. (C; n=2) Kinetics of elution at 37°C (○) or 4°C (▪). The temperature was 4°C or 37°C throughout the first 60 min of binding as well as the 30 min elution. (D; n=3) Kinetics of elution in the presence of vehicle control (DMSO; ○) or 0.5 μM latrunculin A (▪; drugs present throughout the binding and elution).

Similar articles

Cited by

References

    1. MacGlashan D W., Jr Two regions of down-regulation in the IgE-mediated signaling pathway in human basophils. J Immunol. 2003;170:4914–4925. - PubMed
    1. Furuichi K, Rivera J, Isersky C. The fate of IgE bound to rat basophilic leukemia cells. III. Relationship between antigen-induced endocytosis and serotonin release. J Immunol. 1984;133:1513–1520. - PubMed
    1. MacGlashan D W, Jr, Mogowski M, Lichtenstein L M. Studies of antigen binding on human basophils. II. Continued expression of antigen-specific IgE during antigen-induced desensitization. J Immunol. 1983;130:2337–2342. - PubMed
    1. MacGlashan D W., Jr Endocytosis, re-cycling and degradation of unoccupied FcεRI in human basophils. J Leukoc Biol. 2007;82:1003–1010. - PubMed
    1. Pierini L, Harris N T, Holowka D, Baird B. Evidence supporting a role for microfilaments in regulating the coupling between poorly dissociable IgE-Fc εRI aggregates downstream signaling pathways. Biochemistry. 1997;36:7447–7456. - PubMed

Publication types

MeSH terms