Stress phase angle depicts differences in coronary artery hemodynamics due to changes in flow and geometry after percutaneous coronary intervention
- PMID: 19151251
- PMCID: PMC2660241
- DOI: 10.1152/ajpheart.01166.2007
Stress phase angle depicts differences in coronary artery hemodynamics due to changes in flow and geometry after percutaneous coronary intervention
Abstract
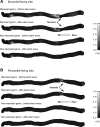
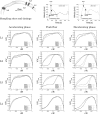
The effects of changes in flow velocity waveform and arterial geometry before and after percutaneous coronary intervention (PCI) in the right coronary artery (RCA) were investigated using computational fluid dynamics. An RCA from a patient with a stenosis was reconstructed based on multislice computerized tomography images. A nonstenosed model, simulating the same RCA after PCI, was also constructed. The blood flows in the RCA models were simulated using pulsatile flow waveforms acquired with an intravascular ultrasound-Doppler probe in the RCA of a patient undergoing PCI. It was found that differences in the waveforms before and after PCI did not affect the time-averaged wall shear stress and oscillatory shear index, but the phase angle between pressure and wall shear stress on the endothelium, stress phase angle (SPA), differed markedly. The median SPA was -63.9 degrees (range, -204 degrees to -10.0 degrees ) for the pre-PCI state, whereas it was 10.4 degrees (range, -71.1 degrees to 25.4 degrees ) in the post-PCI state, i.e., more asynchronous in the pre-PCI state. SPA has been reported to influence the secretion of vasoactive molecules (e.g., nitric oxide, PGI(2), and endothelin-1), and asynchronous SPA ( approximately -180 degrees ) is proposed to be proatherogenic. Our results suggest that differences in the pulsatile flow waveform may have an important influence on atherogenesis, although associated with only minor changes in the time-averaged wall shear stress and oscillatory shear index. SPA may be a useful indicator in predicting sites prone to atherosclerosis.
Figures


Similar articles
-
Interaction between the Stress Phase Angle (SPA) and the Oscillatory Shear Index (OSI) Affects Endothelial Cell Gene Expression.PLoS One. 2016 Nov 15;11(11):e0166569. doi: 10.1371/journal.pone.0166569. eCollection 2016. PLoS One. 2016. PMID: 27846267 Free PMC article.
-
Factors influencing blood flow patterns in the human right coronary artery.Ann Biomed Eng. 2001 Feb;29(2):109-20. doi: 10.1114/1.1349703. Ann Biomed Eng. 2001. PMID: 11284665
-
Local hemodynamic changes caused by main branch stent implantation and subsequent virtual side branch balloon angioplasty in a representative coronary bifurcation.J Appl Physiol (1985). 2010 Aug;109(2):532-40. doi: 10.1152/japplphysiol.00086.2010. Epub 2010 May 27. J Appl Physiol (1985). 2010. PMID: 20507966
-
Does coronary flow trump coronary anatomy?JACC Cardiovasc Imaging. 2009 Aug;2(8):1009-23. doi: 10.1016/j.jcmg.2009.06.004. JACC Cardiovasc Imaging. 2009. PMID: 19679290 Review.
-
Planning percutaneous coronary interventions using computed tomography angiography and fractional flow reserve-derived from computed tomography: A state-of-the-art review.Catheter Cardiovasc Interv. 2019 Feb 1;93(2):298-304. doi: 10.1002/ccd.27817. Epub 2018 Oct 4. Catheter Cardiovasc Interv. 2019. PMID: 30286519 Review.
Cited by
-
Characterization of the differential response of endothelial cells exposed to normal and elevated laminar shear stress.J Cell Physiol. 2011 Nov;226(11):2841-8. doi: 10.1002/jcp.22629. J Cell Physiol. 2011. PMID: 21302282 Free PMC article.
-
High wall shear stress and spatial gradients in vascular pathology: a review.Ann Biomed Eng. 2013 Jul;41(7):1411-27. doi: 10.1007/s10439-012-0695-0. Epub 2012 Dec 11. Ann Biomed Eng. 2013. PMID: 23229281 Free PMC article. Review.
-
Interaction between the Stress Phase Angle (SPA) and the Oscillatory Shear Index (OSI) Affects Endothelial Cell Gene Expression.PLoS One. 2016 Nov 15;11(11):e0166569. doi: 10.1371/journal.pone.0166569. eCollection 2016. PLoS One. 2016. PMID: 27846267 Free PMC article.
-
Magnetoresponsive Functionalized Nanocomposite Aggregation Kinetics and Chain Formation at the Targeted Site during Magnetic Targeting.Pharmaceutics. 2022 Sep 12;14(9):1923. doi: 10.3390/pharmaceutics14091923. Pharmaceutics. 2022. PMID: 36145671 Free PMC article.
-
Behaviour of two typical stents towards a new stent evolution.Med Biol Eng Comput. 2017 Jun;55(6):1019-1037. doi: 10.1007/s11517-016-1574-x. Epub 2016 Sep 26. Med Biol Eng Comput. 2017. PMID: 27669700
References
-
- Asakura T, Karino T. Flow patterns and spatial distribution of atherosclerotic lesions in human coronary arteries. Circ Res 66: 1045–1066, 1990. - PubMed
-
- Atabek HB, Ling SC, Patel DJ. Analysis of coronary flow fields in thoracotomized dogs. Circ Res 37: 752–761, 1975. - PubMed
-
- Augst AD, Ariff B, Thom SA, Xu XY, Hughes AD. Analysis of complex flow and the relationship between blood pressure, wall shear stress, and intima-media thickness in the human carotid artery. Am J Physiol Heart Circ Physiol 293: H1031–H1037, 2007. - PubMed
-
- Caro CG, Fitz-Gerald JM, Schroter RC. Arterial wall shear and distribution of early atheroma in man. Nature 223: 1159–1161, 1969. - PubMed
-
- Cheng C, Helderman F, Tempel D, Segers D, Hierck B, Poelmann R, van Tol A, Duncker DJ, Robbers-Visser D, Ursem TCN, van Haperen R, Wentzel JJ, Gijsen F, van der Steen AFW, de Crom R, Krams R. Large variations in absolute wall shear stress levels within one species and between species. Atherosclerosis 195: 225–235, 2007. - PubMed
Publication types
MeSH terms
Grants and funding
LinkOut - more resources
Full Text Sources
Miscellaneous

