

Patterns of gene-specific and total transcriptional activity during the Plasmodium falciparum intraerythrocytic developmental cycle
- PMID: 19151330
- PMCID: PMC2653245
- DOI: 10.1128/EC.00340-08
Patterns of gene-specific and total transcriptional activity during the Plasmodium falciparum intraerythrocytic developmental cycle
Abstract
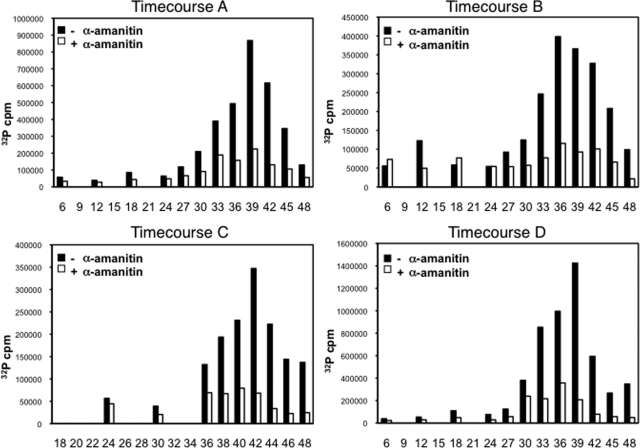
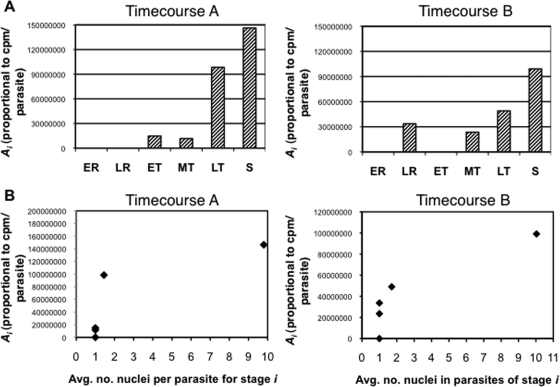
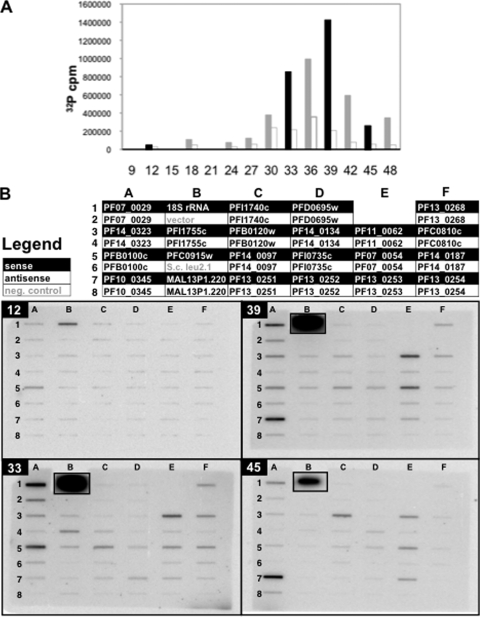
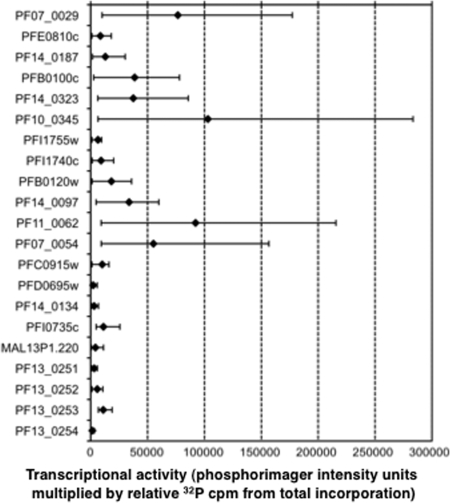
The relationships among gene regulatory mechanisms in the malaria parasite Plasmodium falciparum throughout its asexual intraerythrocytic developmental cycle (IDC) remain poorly understood. To investigate the level and nature of transcriptional activity and its role in controlling gene expression during the IDC, we performed nuclear run-on on whole-transcriptome samples from time points throughout the IDC and found a peak in RNA polymerase II-dependent transcriptional activity related to both the number of nuclei per parasite and variable transcriptional activity per nucleus over time. These differential total transcriptional activity levels allowed the calculation of the absolute transcriptional activities of individual genes from gene-specific nuclear run-on hybridization data. For half of the genes analyzed, sense-strand transcriptional activity peaked at the same time point as total activity. The antisense strands of several genes were substantially transcribed. Comparison of the transcriptional activity of the sense strand of each gene to its steady-state RNA abundance across the time points assayed revealed both correlations and discrepancies, implying transcriptional and posttranscriptional regulation, respectively. Our results demonstrate that such comparisons can effectively indicate gene regulatory mechanisms in P. falciparum and suggest that genes with diverse transcriptional activity levels and patterns combine to produce total transcriptional activity levels tied to parasite development during the IDC.
Figures

Similar articles
-
Quantitative time-course profiling of parasite and host cell proteins in the human malaria parasite Plasmodium falciparum.Mol Cell Proteomics. 2011 Aug;10(8):M110.006411. doi: 10.1074/mcp.M110.006411. Epub 2011 May 10. Mol Cell Proteomics. 2011. PMID: 21558492 Free PMC article.
-
The RNA structurome in the asexual blood stages of malaria pathogen plasmodium falciparum.RNA Biol. 2021 Dec;18(12):2480-2497. doi: 10.1080/15476286.2021.1926747. Epub 2021 Jun 23. RNA Biol. 2021. PMID: 33960872 Free PMC article.
-
The transcriptome of the intraerythrocytic developmental cycle of Plasmodium falciparum.PLoS Biol. 2003 Oct;1(1):E5. doi: 10.1371/journal.pbio.0000005. Epub 2003 Aug 18. PLoS Biol. 2003. PMID: 12929205 Free PMC article.
-
Pernicious plans revealed: Plasmodium falciparum genome wide expression analysis.Curr Opin Microbiol. 2004 Aug;7(4):382-7. doi: 10.1016/j.mib.2004.06.014. Curr Opin Microbiol. 2004. PMID: 15358256 Review.
-
Deconstructing the parasite multiplication rate of Plasmodium falciparum.Trends Parasitol. 2021 Oct;37(10):922-932. doi: 10.1016/j.pt.2021.05.001. Epub 2021 Jun 10. Trends Parasitol. 2021. PMID: 34119440 Review.
Cited by
-
Plasmodium parasites mount an arrest response to dihydroartemisinin, as revealed by whole transcriptome shotgun sequencing (RNA-seq) and microarray study.BMC Genomics. 2015 Oct 21;16:830. doi: 10.1186/s12864-015-2040-0. BMC Genomics. 2015. PMID: 26490244 Free PMC article.
-
Protease-associated cellular networks in malaria parasite Plasmodium falciparum.BMC Genomics. 2011 Dec 23;12 Suppl 5(Suppl 5):S9. doi: 10.1186/1471-2164-12-S5-S9. Epub 2011 Dec 23. BMC Genomics. 2011. PMID: 22369208 Free PMC article.
-
Malian children infected with Plasmodium ovale and Plasmodium falciparum display very similar gene expression profiles.PLoS Negl Trop Dis. 2023 Jan 25;17(1):e0010802. doi: 10.1371/journal.pntd.0010802. eCollection 2023 Jan. PLoS Negl Trop Dis. 2023. PMID: 36696438 Free PMC article.
-
Analysis of the molecular mechanisms governing the stage-specific expression of a prototypical housekeeping gene during intraerythrocytic development of P. falciparum.J Mol Biol. 2011 Apr 29;408(2):205-21. doi: 10.1016/j.jmb.2011.02.043. Epub 2011 Feb 24. J Mol Biol. 2011. PMID: 21354176 Free PMC article.
-
Nascent RNA sequencing reveals mechanisms of gene regulation in the human malaria parasite Plasmodium falciparum.Nucleic Acids Res. 2017 Jul 27;45(13):7825-7840. doi: 10.1093/nar/gkx464. Nucleic Acids Res. 2017. PMID: 28531310 Free PMC article.
References
-
- Bzik, D. J. 1991. The structure and role of RNA polymerases in Plasmodium. Parasitol. Today 7211-214. - PubMed
Publication types
MeSH terms
Substances
Grants and funding
LinkOut - more resources
Full Text Sources
