. 2009 Mar 20;284(12):7951-9.
doi: 10.1074/jbc.M807012200. Epub 2009 Jan 16.

Sulfonylurea receptor 1 mutations that cause opposite insulin secretion defects with chemical chaperone exposure

Affiliations

Sulfonylurea receptor 1 mutations that cause opposite insulin secretion defects with chemical chaperone exposure

Emily B Pratt et al. J Biol Chem. .

Abstract

The beta-cell ATP-sensitive potassium (K(ATP)) channel composed of sulfonylurea receptor SUR1 and potassium channel Kir6.2 serves a key role in insulin secretion regulation by linking glucose metabolism to cell excitability. Mutations in SUR1 or Kir6.2 that decrease channel function are typically associated with congenital hyperinsulinism, whereas those that increase channel function are associated with neonatal diabetes. Here we report that two hyperinsulinism-associated SUR1 missense mutations, R74W and E128K, surprisingly reduce channel inhibition by intracellular ATP, a gating defect expected to yield the opposite disease phenotype neonatal diabetes. Under normal conditions, both mutant channels showed poor surface expression due to retention in the endoplasmic reticulum, accounting for the loss of channel function phenotype in the congenital hyperinsulinism patients. This trafficking defect, however, could be corrected by treating cells with the oral hypoglycemic drugs sulfonylureas, which we have shown previously to act as small molecule chemical chaperones for K(ATP) channels. The R74W and E128K mutants thus rescued to the cell surface paradoxically exhibited ATP sensitivity 6- and 12-fold lower than wild-type channels, respectively. Further analyses revealed a nucleotide-independent decrease in mutant channel intrinsic open probability, suggesting the mutations may reduce ATP sensitivity by causing functional uncoupling between SUR1 and Kir6.2. In insulin-secreting cells, rescue of both mutant channels to the cell surface led to hyperpolarized membrane potentials and reduced insulin secretion upon glucose stimulation. Our results show that sulfonylureas, as chemical chaperones, can dictate manifestation of the two opposite insulin secretion defects by altering the expression levels of the disease mutants.


Figures
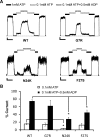
FIGURE 1.
FIGURE 1.
Nucleotide sensitivities of TMD0 mutants G7R, N24K, and F27S. COSm6 cells transfected with Kir6.2 and WT or mutant SUR1 were treated with 300 μm tolbutamide overnight followed by a 2-h washout prior to the recording to rescue mutant channel surface expression. Channel sensitivity to ATP and MgADP was measured by inside-out patch clamp recordings. Recordings in this and subsequent figures were made at -50 mV, and inward currents are shown as upward deflections. A, representative traces of WT and mutant channels showing channel inhibition by ATP and stimulation by MgADP. Patches were exposed to various concentrations of ATP and ADP as indicated by the bars above the recordings. Free [Mg2+] was 1 mm in all solutions. Scale bars: WT: 200 pA, 10 s; G7R: 200 pA, 10 s; N24K: 20 pA, 10 s; F27S: 50 pA, 10 s. B, quantification of channel response to ATP and MgADP. Currents in 0.1 mm ATP or 0.1 mm ATP plus 0.5 mm ADP were normalized to currents in nucleotide-free solution. The ATP sensitivity of N24K is significantly higher than WT while the MgADP sensitivity of both N24K and F27S are significantly lower than WT channels (*, p < 0.05; Student's t test). Increased sensitivity to ATP inhibition and decreased sensitivity to MgADP stimulation are both expected to reduce channel function and are consistent with the CHI disease phenotype. Each bar represents the mean ± S.E. of 3-7 patches.
FIGURE 2.
FIGURE 2.
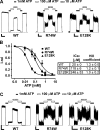
R74W and E128K decrease channel sensitivity to ATP inhibition. ATP sensitivity was measured by inside-out patch clamp recording in COSm6 cells transfected with Kir6.2 and WT or mutant SUR1. A, representative traces of WT and mutant channels from cells treated with 300 μm tolbutamide overnight followed by 2-h washout prior to the recording. Scale bars: WT: 500 pA, 5 s; R74W and E128K: 50 pA, 5 s. B, ATP dose-response relationships. Parameters describing best-fit curves to the Hill equation (Irel = 1/(1 + ([ATP]/IC50)H)), including the [ATP] necessary for half-maximal inhibition (IC50) and Hill coefficient (H), are shown. Error bars represent ± S.E. of 3-7 patches. Note the IC50 values obtained using the K-INT/EDTA solution are higher than those reported by others as inclusion of EDTA significantly reduces rundown by minimizing Mg2+-dependent breakdown of membrane phosphoinositides (20). C, representative traces of WT and mutant channels from cells that have not been pretreated with tolbutamide, indicating the decrease in ATP sensitivity observed in A and B is not due to the chemical chaperone rescue procedure. Scale bars: WT: 500 pA, 10 s; R74W and E128K: 20 pA, 10 s.
FIGURE 3.
FIGURE 3.
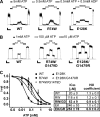
Reduced ATP sensitivity in R74W and E128K is independent of MgADP stimulation. A, representative traces from COSm6, inside-out voltage clamp recordings showing MgADP response in WT and mutant channels. Note 0.5 mm ATP was present during 0.5 mm MgADP stimulation. Free [Mg2+] was 1 mm in all solutions. Scale bars: WT: 50 pA, 10 s; R74W: 50 pA, 10 s; E128K: 500 pA, 10 s. B and C, ATP sensitivity is still reduced in R74W and E128K containing SUR1-NBD mutations G1479D or G1479R. B, representative recordings of WT and double-mutant channels. Scale bars: WT: 300 pA, 5 s; RW/GD (R74W/G1479D): 100 pA, 5 s; EK/GR (E128K/G1479R): 100 pA, 5 s. C, ATP dose-response relationships. Parameters describing best-fit curves are given as in Fig. 2B. All cells were pretreated with 300 μm tolbutamide to increase surface expression. Error bars represent ± S.E. of 3-11 patches.
FIGURE 4.
FIGURE 4.
R74W and E128K reduce channel intrinsic open probability. A, inside-out single channel recordings were made in COSm6 cells co-transfected with KATP subunits. Intrinsic open probability (Po) was determined in Kint/1 mm EDTA solution to prevent rundown. Representative traces are shown as 10 s of recording and the first 1 s of each expanded (indicated by the dotted box), with the Po given parenthetically. Recordings were digitized at 50 kHz and filtered at 2 kHz. Scale bars: 5 pA and 2 s for the 10-s records, 5 pA and 200 μs for the expanded records. B, average Po values ± S.E. are shown in the bar graph. The distribution of individual Po values is displayed; the total number of patches analyzed is shown above each bar (*, p < 0.05, Student's t test; error bars represent ± S.E.).
FIGURE 5.
FIGURE 5.
R74W and E128K surface expression was rescued by sulfonylurea treatment in insulin-secreting cells. Processing and surface expression of KATP channels was assessed in INS-1 cells infected with Kir6.2 and WT or mutant fSUR1 adenoviruses. A, Western blot of fSUR1. The complex-glycosylated mature form of fSUR1 is indicated by the open arrow and the core-glycosylated immature form by the solid arrow. The upper band is undetectable in untreated R74W- and E128K-infected cells, indicating defective channel processing and trafficking. Sulfonylurea treatment, however, restores upper band expression. The same blot was probed for α-tubulin to confirm equal loading of protein samples. B, surface immunostaining with FLAG-antibody of fSUR1 showed that R74W and E128K mutant channels are only detected at the cell surface following tolbutamide treatment. C, KATP surface expression in INS-1 cells was quantified using chemiluminescence assays. Under control conditions, R74W and E128K both express at 9% of WT. Sulfonylurea treatment greatly improves R74W and E128K expression to 90 and 80%, respectively. Error bars represent ±S.E. of three experiments. D, islets isolated from rat pancreas were cultured for 48 h and then infected with KATP subunit-encoding adenoviruses. Exogenous KATP biogenesis was tracked by Western blot of FLAG epitope. The upper band of fSUR1 was only detected following 5 μm glibenclamide treatment. A nonspecific band in the E128K blot is shown to serve as a loading control.
FIGURE 6.
FIGURE 6.
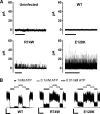
R74W and E128K have inappropriate channel openings in intact cells following high glucose stimulation. A, on-cell voltage clamp recordings were made in INS-1 cells co-infected with the KATP subunit-encoding adenoviruses and pretreated with 300 μm tolbutamide to rescue mutant surface expression followed by 3-h washout in 12 mm glucose medium. High glucose stimulation should cause a rise in intracellular ATP and inhibition of KATP channels. Representative current traces showing that both uninfected control and WT-infected cells had little or no channel activity; however, both R74W and E128K had robust channel openings. Scale bars: 10 s. B, membrane patches were excised into inside-out configuration from WT- or mutant-infected and tolbutamide-pretreated INS-1 cells after on-cell recording shown in A to test channel ATP sensitivity. Representative traces show that channels from mutant-infected and tolbutamide rescued cells have decreased ATP sensitivity compared with channels from WT-infected and tolbutamide pretreated cells. Scale bars: WT: 50 pA, 10 s; R74W: 100 pA, 10 s; E128K: 50 pA, 10 s.
FIGURE 7.
FIGURE 7.
R74W or E128K expression at the plasma membrane results in a diabetes phenotype. INS-1 cells were co-infected with the KATP subunit-encoding adenoviruses followed by pretreatment with 300 μm tolbutamide and washout to rescue surface expression where indicated. A and B, initial and post-break-in steadystate membrane potentials following 12 mm glucose stimulation were determined by whole cell current clamp recordings. Representative traces are shown in A. Scale bars represent 10 s of recording, and the downward arrow specifies the time of break-in. The initial spike is an artifact going from on-cell to whole cell mode. The average membrane potential values are shown in B. Each bar represents the mean ± S.E. of 11-30 cells. *, p < 0.05; #, p < 0.01, Student's t test. C, insulin secretion at basal (3 mm) and 12 mm glucose in uninfected controls and WT-, R74W-, or E128K-infected INS-1 cells. R74W- and E128K-infected cells pretreated with 300 μm tolbutamide for 4 h to rescue surface expression had significantly less insulin secretion relative to control or WT-infected cells. In R74W- or E128K-infected cells without tolbutamide rescue, insulin secretion was also reduced likely due to some leak expression of the mutants, although the extent of reduction was less than tolbutamide-rescued cells. *, p < 0.05; #, p < 0.01, Student's t test. Each bar represents the mean ± S.E. of three to five experiments.

Similar articles

Cited by

References

    1. Aguilar-Bryan, L., and Bryan, J. (1999) Endocr. Rev. 20 101-135 - PubMed
    1. Ashcroft, F. M. (2005) J. Clin. Invest. 115 2047-2058 - PMC - PubMed
    1. Neagoe, I., and Schwappach, B. (2005) J. Mol. Cell Cardiol. 38 887-894 - PubMed
    1. Heusser, K., Yuan, H., Neagoe, I., Tarasov, A. I., Ashcroft, F. M., and Schwappach, B. (2006) J. Cell Sci. 119 4353-4363 - PubMed
    1. Yan, F. F., Lin, C. W., Cartier, E. A., and Shyng, S. L. (2005) Am. J. Physiol. 289 C1351-C1359 - PMC - PubMed

Publication types

MeSH terms