Review
. 2009 Mar;4(1):101-9.
doi: 10.1093/scan/nsn044. Epub 2009 Jan 17.

Revealing representational content with pattern-information fMRI--an introductory guide

Affiliations
Review

Revealing representational content with pattern-information fMRI--an introductory guide

Marieke Mur et al. Soc Cogn Affect Neurosci. 2009 Mar.

Abstract

Conventional statistical analysis methods for functional magnetic resonance imaging (fMRI) data are very successful at detecting brain regions that are activated as a whole during specific mental activities. The overall activation of a region is usually taken to indicate involvement of the region in the task. However, such activation analysis does not consider the multivoxel patterns of activity within a brain region. These patterns of activity, which are thought to reflect neuronal population codes, can be investigated by pattern-information analysis. In this framework, a region's multivariate pattern information is taken to indicate representational content. This tutorial introduction motivates pattern-information analysis, explains its underlying assumptions, introduces the most widespread methods in an intuitive way, and outlines the basic sequence of analysis steps.


Figures

Fig. 1
Fig. 1
Activation indicates involvement, pattern-information indicates representational content. A specific ROI can show the same spatial-average activation resulting from different patterns encoding different representational content. This figure shows a hypothetical ROI consisting of nine voxels. The ROI's multivoxel pattern of activity is different for /ra/ than /la/ speech sounds, but these different patterns result in the same spatial-average activation. This difference will go undetected by conventional activation-based analysis. Pattern-information analysis can be used to show that an ROI's multivoxel activity pattern differs significantly across conditions, i.e. that the region contains information about the experimental conditions. Differences in multivoxel patterns across conditions can be interpreted as reflecting differences in underlying neuronal population activity. This figure has been adapted with permission from Raizada et al. (2008).
Fig. 2
Fig. 2
Linear classification methods all define a linear decision boundary, but the boundary is placed slightly differently. This is shown for a given set of hypothetical activity patterns. The blue dots represent activity patterns for one experimental condition (e.g. the speech sound /ra/), the red dots represent activity patterns for a second condition (e.g. the speech sound /ra/). For simplicity, the displayed activity patterns are based on activity of only two voxels. Nevertheless, the classification methods generalize to higher-dimensional voxel spaces. The ellipses in the background of each panel are iso-probability-density contours describing the bivariate normal distribution of the activity patterns for each condition. The yellow circles indicate the geometrical features that define the linear decision boundary (green) for each classifier. (A) Minimum-distance classifier. This classifier first determines the centroids of the two multivariate distributions (large dots). Each activity pattern is then classified as the condition whose centroid it is closest to in multivariate space (using Euclidean distance here, as shown by the dotted lines). This implies a linear decision boundary (i.e. a hyperplane) orthogonal to the centroid connection line, equally dividing the distance between the two centroids. (B) Fisher linear discriminant analysis (FLDA). Response patterns are projected onto a linear discriminant dimension by weighting each voxel's activity in order to maximize the ratio of between-condition and within-condition variance. The voxel weights define a weight vector that points in the direction of the linear discriminant dimension. The patterns (i.e. the data points) are orthogonally projected onto the discriminant dimension and a threshold is used for classification. This implies a linear decision boundary (i.e. a hyperplane) orthogonal to the linear discriminant dimension. (C) Linear SVM. Same description as FLDA, except for the way the voxel weights are computed. The voxel weights computed by linear SVM are set to yield a linear decision boundary that maximizes the margin (i.e. the distance of the nearest data point to the decision boundary). To make this intuitive, we can imagine starting with a decision boundary that perfectly classifies the training set, then widening the margin equally on both sides while adjusting the angle and position of the decision boundary, until the margin cannot be widened anymore without including one of the training data points. The response patterns closest to the decision boundary (points in yellow circles) then define the margins and the decision boundary halfway in-between the margins. These points are therefore called “support vectors”. In order to handle overlapping distributions, SVM algorithms are typically set to allow for a few misclassifications on the training set (see the two transparent points in our hypothetical example).
Fig. 3
Fig. 3
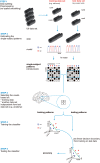
Pattern-information analysis: step-by-step. Schematic illustration of the five steps of pattern-information analysis as described in the text. First, data are split into a training and a test data set and preprocessed separately. Then, single-subject patterns of activity are estimated from the data using univariate analysis (GLM) at each voxel. This results in whole-brain activity patterns consisting of beta-estimates. Black boxes indicate activated voxels; white boxes indicate nonactivated voxels. Note that activity levels are continuous in analysis and only stated as binary here for simplicity. There will be as many patterns as there are predictors (conditions) in the model. Pattern-estimation is done separately for the training and test data set. The third step consists of selecting voxels for pattern-information analysis. This can be done based on anatomy, function or both. For simplicity, the shown example region consists of four voxels only. Voxel selection should be based on the training data set or another data set that is independent from the test data set in order to prevent biased testing results. This also applies to STEP 4: voxel weighting should be performed on the training data set to prevent biased testing results. Voxels are weighted in order to maximize discriminability of the patterns belonging to the two conditions. The voxel weights computed in STEP 4 can then be tested on the test data set in STEP 5. If the weights capture true differences between the two conditions, good performance (classification accuracy) on the training data set will generalize to the test data set. Performance significantly better than chance indicates that the ROI contains information about the experimental conditions, i.e. the representational content of the region differs across conditions. The image for STEP 3 has been adapted with permission from Raizada et al. (2008).

References

    1. Aguirre GK. Continuous carry-over designs for fMRI. Neuroimage. 2007;35:1480–94. - PMC - PubMed
    1. Bandettini PA, Cox RW. Event-related fMRI contrast when using constant interstimulus interval: Theory and experiment. Magnetic Resonance in Medicine. 2000;43:540–8. - PubMed
    1. Birn RM, Cox RW, Bandettini PA. Detection versus estimation in event-related fMRI: Choosing the optimal stimulus timing. Neuroimage. 2002;15:252–64. - PubMed
    1. Boynton GM, Engel SA, Glover GH, Heeger DJ. Linear systems analysis of functional magnetic resonance imaging in human V1. The Journal of Neuroscience. 1996;16:4207–21. - PMC - PubMed
    1. Carlson TA, Schrater P, He S. Patterns of activity in the categorical representations of objects. Journal of Cognitive Neuroscience. 2003;15:704–17. - PubMed

Publication types

MeSH terms