

doi: 10.1038/nn.2255.
Epub 2009 Jan 18.
Laminar and compartmental regulation of dendritic growth in mature cortex
Affiliations
- PMID: 19151711
- PMCID: PMC2842592
- DOI: 10.1038/nn.2255
Item in Clipboard
Laminar and compartmental regulation of dendritic growth in mature cortex
Nat Neurosci.
2009 Feb.
Abstract
Can dendrites grow in mature cortex? We used chronic in vivo imaging to follow pyramidal neurons before and after cortical deletion of the Pten tumor suppressor gene in mature mice. We found that Pten/mTOR signaling uniquely regulates the growth of layer 2/3 apical dendrites; no effects of gene deletion were observed on basal dendrites of these pyramidal neurons or along layer 5 apical dendrites.
Figures
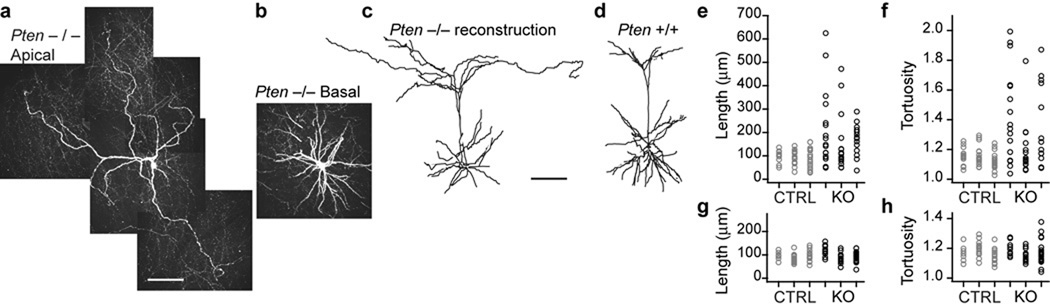
(a) Photomontage of maximum intensity projections of the apical dendritic tree of a layer 2/3 pyramidal neuron imaged in a 4 month old Pten−/− mouse. (b) Basal dendrites of the same neuron in (a). (c) Coronal reconstruction of the full dendritic tree of the cell in (a) and (b). (d) Similar view of a layer 2/3 pyramidal neuron from a control mouse. Scale bars are 100µm. (e,g) Lengths and (f,h) tortuosities of the terminal apical and basal dendrites, respectively, from 3 neurons in control (CTRL) and Pten−/− (KO) mice.
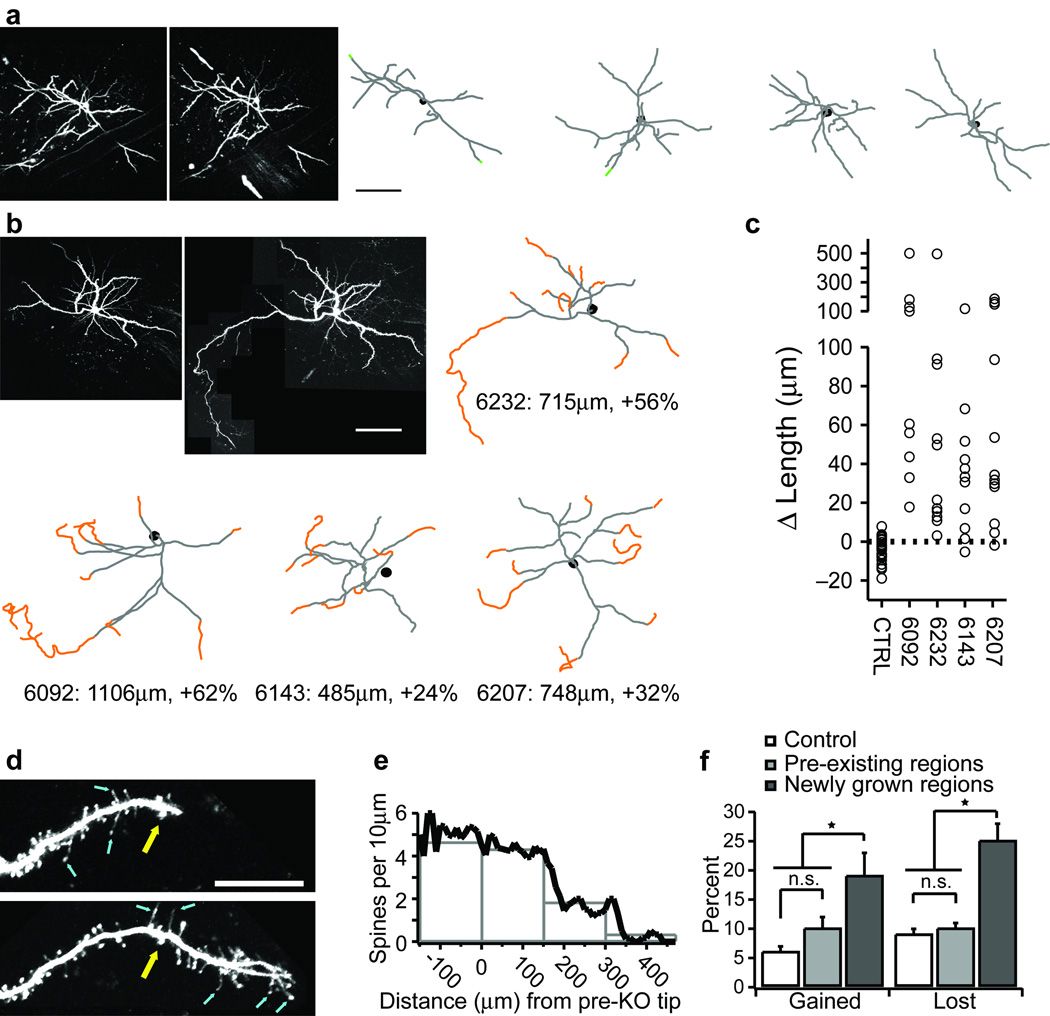
Low magnification views of the same layer 2/3 (L2/3) apical dendrites imaged in vivo at PW8 and PW12 in control (a) and Pten−/− (b) mice. Reconstructions of these cells and 3 additional control and Pten−/− cells are shown. Dendritic growths over this period are shown in orange, retractions are shown in green. (c) Total growth and fractional change in the apical tree over a one-month interval. Controls are pooled. Each neuron in (b) is plotted separately. Each circle represents one dendrite (control: n=59 dendrites; Pten−/−: n=43 dendrites). (d) High magnification time-series of a growing L2/3 apical dendrite following Pten deletion. Top image acquired at PW9, bottom at PW10. Yellow arrow identifies a fiducial spine. Blue arrows identify filopodia. (e) Spine density as a function of distance grown. (f) Fractional spine gain and loss over a 2-week interval from control, pre-existing, and newly grown dendrites. * significance at P<0.01. Error bars are s.d. Scale bars: a&b, 100µm; d, 20µm.
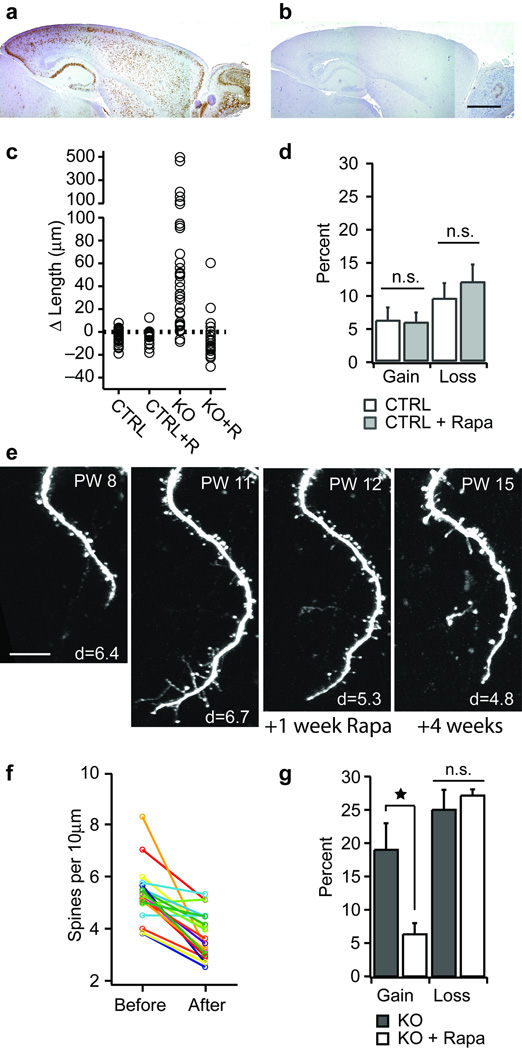
(a) pS6 staining in a sagittal section from a PW14 Pten−/− mouse. (b) pS6 staining in a PW14 Pten−/− mouse given rapamycin for 2 weeks. (c) Dendritic length changes observed over a 4 week interval in control (CTRL; n=4 cells, 59 dendrites), control given rapamycin (CTRL+R; n=3 cells, 23 dendrites), Pten−/− (KO, n=4 cells, 43 dendrites), and Pten−/− given rapamycin (KO+R; n=3 cells, 26 dendrites). (d) Spine gain and loss in control (CTRL, n=362 spines) mice and mice given daily rapamycin (CTRL + Rapa, n=291 spines). (e) Time series showing the growth of a dendrite following Pten deletion and subsequent treatment with rapamycin. Rapamycin treatment began immediately after the image was acquired at PW11. Note the retraction between PW11 and PW12. Age at imaging is stamped in the upper right corner of each panel. Spine density per 10µm for each image is stamped in the lower right corner. (f) Spine density measured along the same dendrites repeatedly imaged in vivo over a 2-week period of rapamycin treatment. Each circle is a separate dendrite. (g) Fractional gain and loss of spines along L2/3 apical dendrites imaged over a 2-week period in Pten−/− mice (KO; n=407 spines), and Pten−/− mice given daily rapamycin (KO + Rapa; n=536 spines). Error bars are s.d. * denotes significance at P<0.01. Scale bars: a&b, 1mm; e, 20µm.
References
-
- Hausser M, Spruston N, Stuart GJ. Diversity and dynamics of dendritic signaling. Science. 2000;290:739–744. - PubMed
-
- Wong RO, Ghosh A. Activity-dependent regulation of dendritic growth and patterning. Nat Rev Neurosci. 2002;3:803–812. - PubMed
-
- Cline HT. Dendritic arbor development and synaptogenesis. Curr Opin Neurobiol. 2001;11:118–126. - PubMed
-
- Trachtenberg JT, et al. Long-term in vivo imaging of experience-dependent synaptic plasticity in adult cortex. Nature. 2002;420:788–794. - PubMed
-
- Holtmaat A, Wilbrecht L, Knott GW, Welker E, Svoboda K. Experience-dependent and cell-type-specific spine growth in the neocortex. Nature. 2006;441:979–983. - PubMed
Publication types
MeSH terms
Substances
Grants and funding
LinkOut - more resources
Full Text Sources
Molecular Biology Databases
Research Materials
Miscellaneous
