

Transcriptomic and proteomic profiling of two porcine tissues using high-throughput technologies
- PMID: 19152685
- PMCID: PMC2633351
- DOI: 10.1186/1471-2164-10-30
Transcriptomic and proteomic profiling of two porcine tissues using high-throughput technologies
Abstract
Background: The recent development within high-throughput technologies for expression profiling has allowed for parallel analysis of transcriptomes and proteomes in biological systems such as comparative analysis of transcript and protein levels of tissue regulated genes. Until now, such studies of have only included microarray or short length sequence tags for transcript profiling. Furthermore, most comparisons of transcript and protein levels have been based on absolute expression values from within the same tissue and not relative expression values based on tissue ratios.
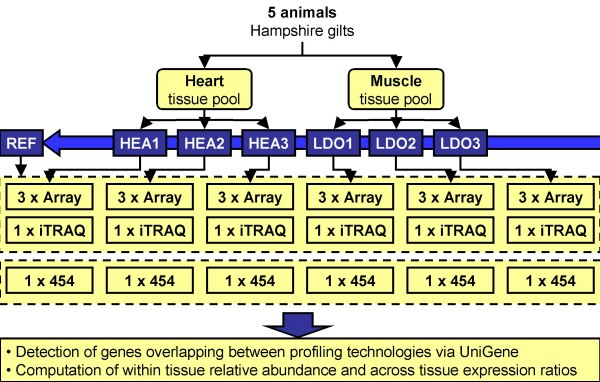
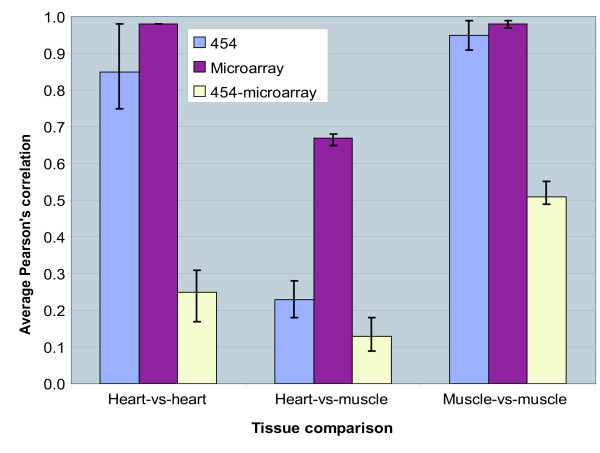
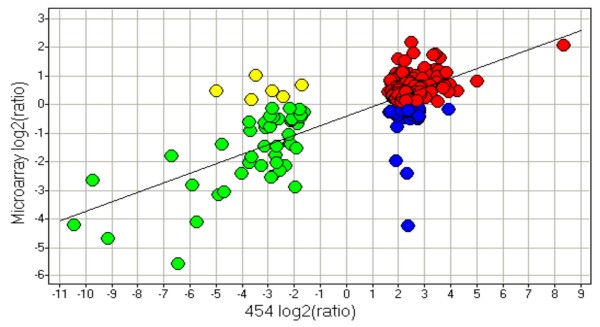
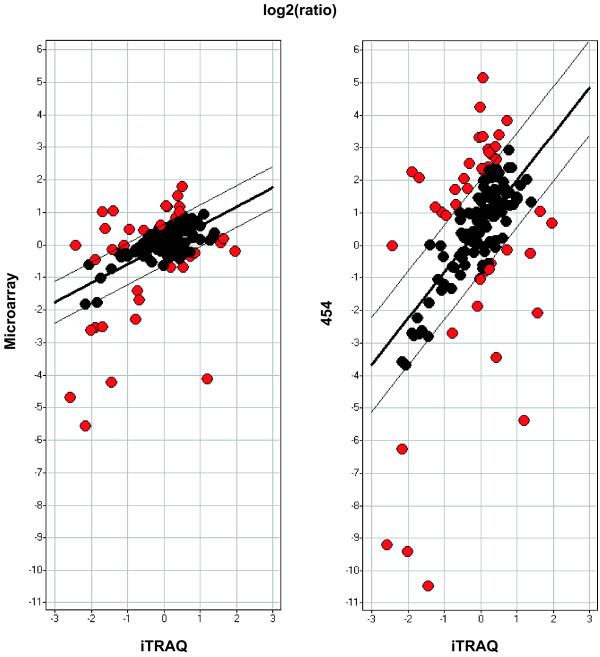
Results: Presented here is a novel study of two porcine tissues based on integrative analysis of data from expression profiling of identical samples using cDNA microarray, 454-sequencing and iTRAQ-based proteomics. Sequence homology identified 2.541 unique transcripts that are detectable by both microarray hybridizations and 454-sequencing of 1.2 million cDNA tags. Both transcript-based technologies showed high reproducibility between sample replicates of the same tissue, but the correlation across these two technologies was modest. Thousands of genes being differentially expressed were identified with microarray. Out of the 306 differentially expressed genes, identified by 454-sequencing, 198 (65%) were also found by microarray. The relationship between the regulation of transcript and protein levels was analyzed by integrating iTRAQ-based proteomics data. Protein expression ratios were determined for 354 genes, of which 148 could be mapped to both microarray and 454-sequencing data. A comparison of the expression ratios from the three technologies revealed that differences in transcript and protein levels across heart and muscle tissues are positively correlated.
Conclusion: We show that the reproducibility within cDNA microarray and 454-sequencing is high, but that the agreement across these two technologies is modest. We demonstrate that the regulation of transcript and protein levels across identical tissue samples is positively correlated when the tissue expression ratios are used for comparison. The results presented are of interest in systems biology research in terms of integration and analysis of high-throughput expression data from mammalian tissues.
Figures
Similar articles
-
A comparison of microarray and MPSS technology platforms for expression analysis of Arabidopsis.BMC Genomics. 2007 Nov 12;8:414. doi: 10.1186/1471-2164-8-414. BMC Genomics. 2007. PMID: 17997849 Free PMC article.
-
Comparison of oligonucleotide-microarray and serial analysis of gene expression (SAGE) in transcript profiling analysis of megakaryocytes derived from CD34+ cells.Exp Mol Med. 2003 Oct 31;35(5):460-6. doi: 10.1038/emm.2003.60. Exp Mol Med. 2003. PMID: 14646601
-
Novel breast cancer biomarkers identified by integrative proteomic and gene expression mapping.J Proteome Res. 2008 Apr;7(4):1518-28. doi: 10.1021/pr700820g. Epub 2008 Mar 5. J Proteome Res. 2008. PMID: 18318472
-
[Transcriptomes for serial analysis of gene expression].J Soc Biol. 2002;196(4):303-7. J Soc Biol. 2002. PMID: 12645300 Review. French.
-
Proteomes and transcriptomes of the Apicomplexa--where's the message?Int J Parasitol. 2009 Jan;39(2):135-43. doi: 10.1016/j.ijpara.2008.10.003. Epub 2008 Nov 1. Int J Parasitol. 2009. PMID: 18996390 Review.
Cited by
-
Nuclear Factor kappa B is central to Marek's disease herpesvirus induced neoplastic transformation of CD30 expressing lymphocytes in-vivo.BMC Syst Biol. 2012 Sep 14;6:123. doi: 10.1186/1752-0509-6-123. BMC Syst Biol. 2012. PMID: 22979947 Free PMC article.
-
The Pig PeptideAtlas: A resource for systems biology in animal production and biomedicine.Proteomics. 2016 Feb;16(4):634-44. doi: 10.1002/pmic.201500195. Proteomics. 2016. PMID: 26699206 Free PMC article.
-
Toward a complete in silico, multi-layered embryonic stem cell regulatory network.Wiley Interdiscip Rev Syst Biol Med. 2010 Nov-Dec;2(6):708-33. doi: 10.1002/wsbm.93. Wiley Interdiscip Rev Syst Biol Med. 2010. PMID: 20890967 Free PMC article. Review.
-
Integrative analysis of transcriptomics and proteomics of skeletal muscles of the Chinese indigenous Shaziling pig compared with the Yorkshire breed.BMC Genet. 2016 Jun 13;17(1):80. doi: 10.1186/s12863-016-0389-y. BMC Genet. 2016. PMID: 27296698 Free PMC article.
-
Integration of deep transcriptome and proteome analyses reveals the components of alkaloid metabolism in opium poppy cell cultures.BMC Plant Biol. 2010 Nov 18;10:252. doi: 10.1186/1471-2229-10-252. BMC Plant Biol. 2010. PMID: 21083930 Free PMC article.
References
-
- Hedegaard J, Skovgaard K, Mortensen S, Sorensen P, Jensen TK, Hornshoj H, et al. Molecular characterisation of the early response in pigs to experimental infection with Actinobacillus pleuropneumoniae using cDNA microarrays. Acta Vet Scand. 2007;49:11. doi: 10.1186/1751-0147-49-11. - DOI - PMC - PubMed
Publication types
MeSH terms
Substances
LinkOut - more resources
Full Text Sources
Molecular Biology Databases
