. 2009 Jun;27(5):672-80.
doi: 10.1016/j.mri.2008.11.008. Epub 2009 Jan 17.

Quantitative intact specimen magnetic resonance microscopy at 3.0 T

Affiliations

Quantitative intact specimen magnetic resonance microscopy at 3.0 T

Kevin G Bath et al. Magn Reson Imaging. 2009 Jun.

Abstract

In this report, we discuss the application of a methodology for high-contrast, high-resolution magnetic resonance microscopy (MRM) of murine tissue using a 3.0-T imaging system. We employed a threefold strategy that included customized specimen preparation to maximize image contrast, three-dimensional data acquisition to minimize scan time and custom radiofrequency resonator design to maximize signal sensitivity. Images had a resolution of 100 x 78 x 78 microm(3) with a signal-to-noise ratio per voxel greater than 25:1 and excellent contrast-to-noise ratios over a 30-min acquisition. We quantitatively validated the methods through comparisons of neuroanatomy across two lines of genetically engineered mice. Specifically, we were able to detect volumetric differences of as little as 9% between genetically engineered mouse strains in multiple brain regions that were predictive of underlying impairments in brain development. The overall methodology was straightforward to implement and provides ready access to basic MRM at field strengths that are widely available in both the laboratory and the clinic.


Figures
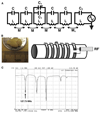
Fig. 1
Fig. 1
The inductively coupled solenoidal radiofrequency resonator design. (A) Circuit diagram of the resonator showing the five individual resonant loops coupled via mutual inductance and driven with an inductively coupled drive loop. Capacitor values were as follows: C=62 pF, C1=30 pF, C2=30 pF and Cv=5–40 pF. Adjustment of the distance between the drive loop and the resonator facilitated matching of the resonator with the 50-Ω transmission line leading to the RF transmitter and receiver (not shown). (B) A fixed specimen of the murine brain and sketch of the resonator showing the positions of the capacitors, drive loop and transmission line. (C) The resonant mode spectrum of the five-element resonator. The five discrete modes predicted from the dispersion relation are visible, but only the lowest in frequency produces a field profile with all elements oscillating in phase and therefore most suitable for imaging.
Fig. 2
Fig. 2
Murine neuroanatomy obtained via MRM at 3.0 T. (A,B) Datasets obtained in 30 min using (A) Gd-DTPA-infused saline or (B) Gd-DTPA-infused saline followed by substitution with deuterated water. (C) Comparison with a Nissl-stained histological section. (D) Coronal brain image showing blood vessels in the hippocampus (green arrows) and (inset) a comparable histologically prepared section labeled with isolectin B-4 (red — a marker for vasculature) and counterstained with TO-PRO3 (blue).
Fig. 3
Fig. 3
MRM of hippocampal anatomy. (A) Image of murine hippocampus clearly showing the cell layers CA1, CA3 and the dentate gyrus (DG) of the hippocampus. The image was interpolated to a 1024×1024 matrix before cropping. (B) Corresponding histological section. (C) 3.0-T, 30-min MRM of the mouse brain in three planes from the MP-RAGE dataset. (D) Surface and (E) partially transparent mean intensity plot of regions probed for volumetric analysis, including the OB, cerebral cortex, cerebellum and hippocampus. Close inspection of both images reveals significant neurovascular architecture.
Fig. 4
Fig. 4
Comparison of 3.0-T MRM to standard histological techniques. Bar graphs depicting hippocampal volume measurements obtained from individual brains of wild-type C57BL/6 mice for (A) comparison between MRM and histology (n=6), (B) measure–remeasure reliability [n=6, same cohort as in (A)] and (C) inter-rater reliability for volume measurements from a second set of brains (n=8).
Fig. 5
Fig. 5
Quantification of disruption in OB neurogenesis in TrkB-haploinsufficient mice. (Left) Bar graphs depicting the quantification of BrdU-positive cells in the granule cell layer of the OB for TrkB wild-type (+/+; n=4) and heterozygous (+/−; n=4) mice. (Right) Representative images of BrdU-labeled (brown) OB sections that were lightly counterstained with cresyl violet (see text for details).

References

    1. Benveniste H, Blackband S. MR microscopy and high resolution small animal MRI: applications in neuroscience research. Prog Neurobiol. 2002;67:393–420. - PubMed
    1. Johnson GA, Cofer GP, Gewalt SL, Hedlund LW. Morphological phenotyping with MR microscopy: the visible mouse. Radiology. 2002;222:789–793. - PubMed
    1. Johnson GA, Thompson MB, Drayer BP, Bone SN. Magnetic resonance microscopy in neurologic models. Acta Radiol Suppl. 1986;369:267–268. - PubMed
    1. Johnson GA, Thompson MB, Gewalt SL, Hayes CE. Nuclear magnetic resonance imaging at microscopic resolution. J Magn Reson. 1986;68:129–137.
    1. Ballon DJ, Graham MC, Miodownik S, Koutcher JA. Doubly tuned solenoidal resonators for small animal imaging and spectroscopy at 1.5 tesla. Magn Reson Med. 1989;7:155–162. - PubMed

Publication types