. 2009 Apr;37(5):1672-81.
doi: 10.1093/nar/gkp002. Epub 2009 Jan 19.

Functional links between clustered microRNAs: suppression of cell-cycle inhibitors by microRNA clusters in gastric cancer

Affiliations

Functional links between clustered microRNAs: suppression of cell-cycle inhibitors by microRNA clusters in gastric cancer

Young-Kook Kim et al. Nucleic Acids Res. 2009 Apr.

Abstract

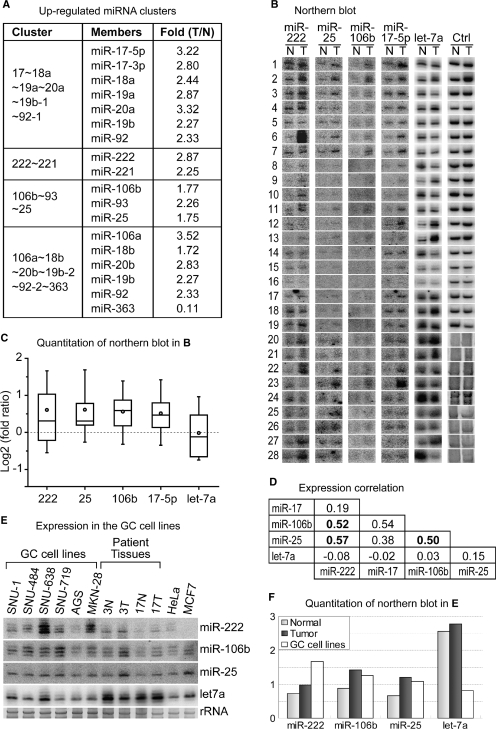
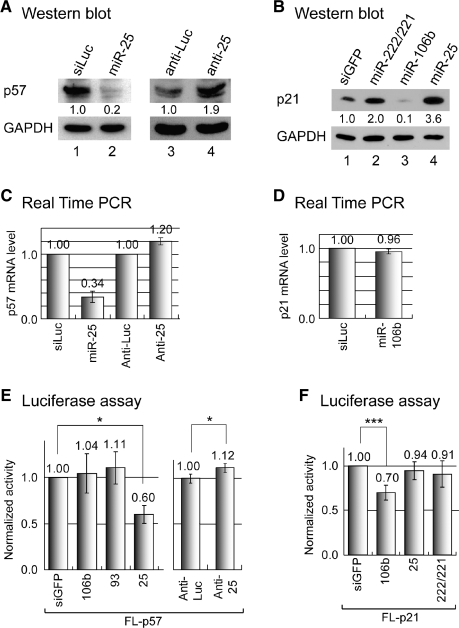
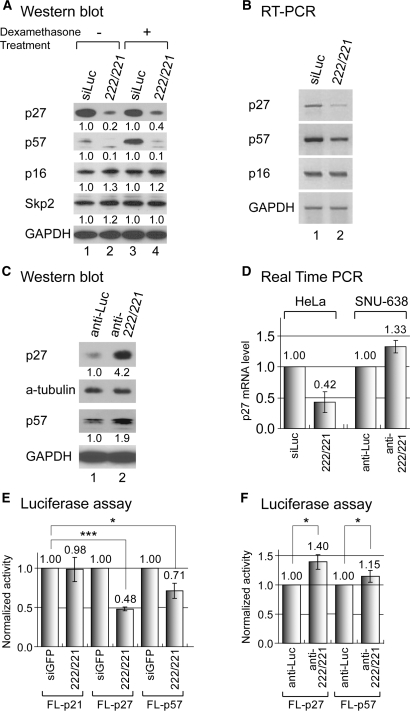
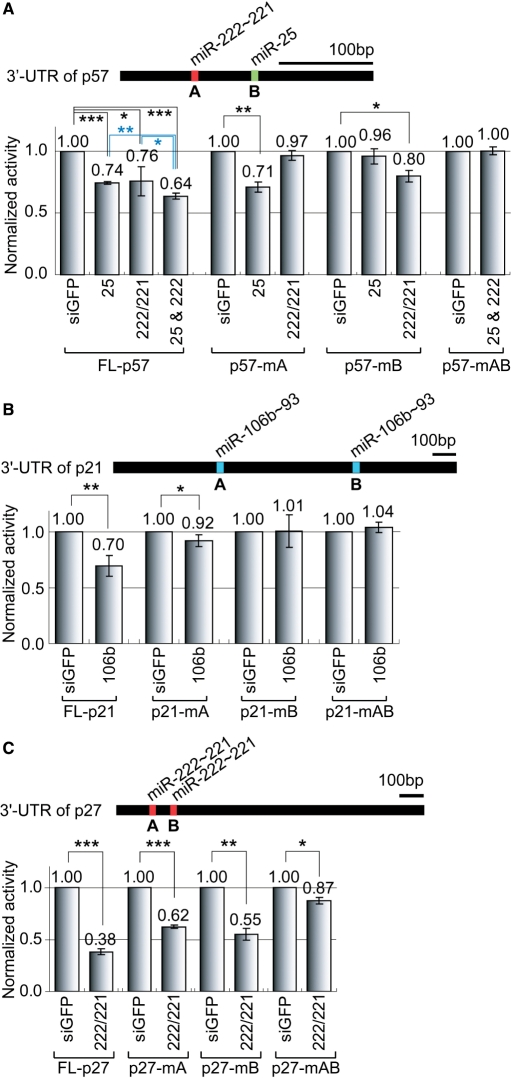
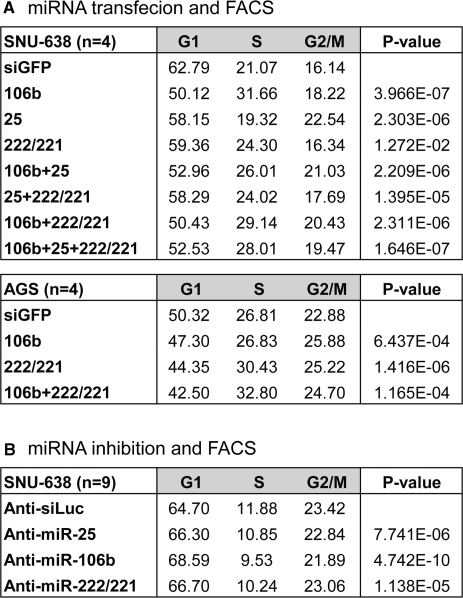
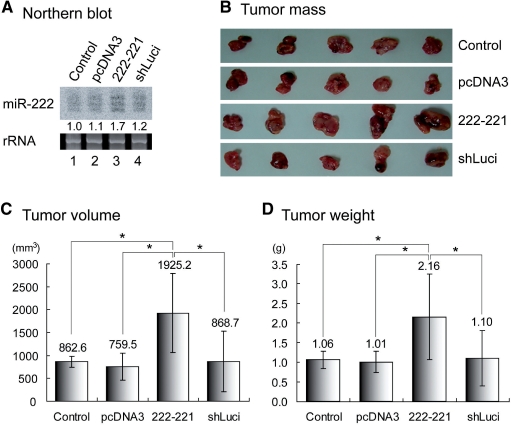
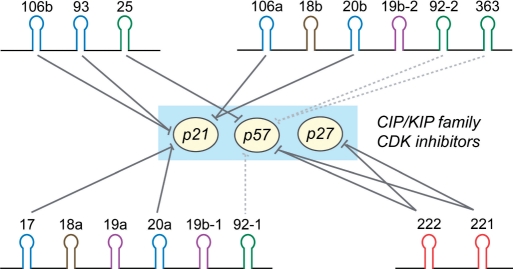
microRNAs (miRNAs) play integral roles in diverse processes including tumorigenesis. miRNA gene loci are often found in close conjunction, and such clustered miRNA genes are transcribed from a common promoter to generate polycistronic primary transcript. The primary transcript (pri-miRNA) is then processed by two RNase III proteins to release the mature miRNAs. Although it has been speculated that the miRNAs in the same cluster may play related biological functions, this has not been experimentally addressed. Here we report that the miRNAs in two clusters (miR-106b approximately 93 approximately 25 and miR-222 approximately 221) suppress the Cip/Kip family members of Cdk inhibitors (p57(Kip2), p21(Cip1) and p27(Kip1)). We show that miR-25 targets p57 through the 3'-UTR. Furthermore, miR-106b and miR-93 control p21 while miR-222 and miR-221 regulate both p27 and p57. Ectopic expression of these miRNAs results in activation of Cdk2 and facilitation of G1/S phase transition. Consistent with these results, both clusters are abnormally upregulated in gastric cancer tissues compared to the corresponding normal tissues. Ectopic expression of miR-222 cluster enhanced tumor growth in the mouse xenograft model. Our study demonstrates the functional associations between clustered miRNAs and further implicates that effective cancer treatment may require a combinatorial approach to target multiple oncogenic miRNA clusters.


Figures

Figure 1.
Figure 1.
Expression of miRNA clusters in gastric cancer tissues. (A) Selected results from microarray experiments. The table presents the miRNA clusters whose members are upregulated in tumor samples. (B) Northern blotting. Total RNA was extracted from frozen tissue samples from gastric cancer patients. Both normal (left, N) and tumor (right, T) tissues from the same donor were analyzed side by side. Control RNAs (tRNA for sample No. 1-19 or rRNA for sample No. 20-28) demonstrate equal loading of RNA. (C) Statistical analysis of northern blotting. The band intensity from northern blots was measured (Supplementary Table 2) and the intensity ratio (tumor/normal) was used to calculate Log2 value. A box plot was drawn for each miRNA. The circles indicate the mean values. Boxes and whiskers range from 25% to 75% and from 10% to 90%, respectively. (D) Expression correlation among miRNAs. Correlation coefficient between each miRNA pair was calculated based on the results from northern blotting. The array of intensity ratio (tumor/normal) from each miRNA was grouped to calculate the correlation coefficients. (E) Enhanced expression of miR-222, miR-106b and miR-25 in gastric cancer cells. Thirty micrograms of total RNA were used for northern analysis. The average levels of miR-222, miR-106b and miR-25 in gastric cancer (GC) cell lines are higher than those in normal stomach tissues. (F) Quantitation of northern blotting in (E).
Figure 2.
Figure 2.
Regulation of p57 and p21 by miR-106b∼93 ∼ 25 cluster. (A) Western blot analysis of p57 protein. HeLa cells were transfected with miR-25 or control siRNA (siLuc) duplex (30 nM). To inhibit miRNA function, either control (anti-Luc) or miR-25 inhibitor (anti-25) was used (200 nM). Because the p57 level is usually low, 1 day after the transfection of RNA duplexes, dexamethasone (100 nM) was used in HeLa cells for 16 h in lanes 1 and 2. In the case of lanes 3 and 4, dexamethasone (100 nM) was treated for 4 h after 36 h of transfection. Band intensity of p57 was measured using densitometer and normalized against that of GAPDH. (B) Western blot analysis of p21. A total of 30 nM of small RNA duplexes were transfected into MCF7 cells. Two days later, western blot was carried out. (C) Quantitative RT-PCR to measure the p57 mRNA level after the transfection of miR-25 duplex (left) or anti-miR-25 (right). The same cells as in (A) were used. (D) Quantitative RT-PCR to measure the p21 mRNA level after the transfection of miR-106b into HeLa cells. (E) p57 is directly regulated by miR-25 through the 3′-UTR. The reporter containing the 3′-UTR of p57 (FL-p57) was co-transfected with miRNA duplexes or antisense inhibitors into HeLa cells. Luciferase assay was carried out 24 h post-transfection (n = 3, mean±SD). (F) p21 is directly regulated by miR-106b through the 3′-UTR. The reporter containing the 3′-UTR of p21 (FL-p21) was transfected into HeLa cells along with miRNA duplexes (n = 5, mean±SD). Paired one-tail T-test was used to calculate the P-value (*P < 0.1, ***P < 0.001).
Figure 3.
Figure 3.
Regulation of p27 and p57 by miR-222 ∼ 221 cluster. (A) Western blot analysis shows that p27 and p57 proteins are down-modulated by miR-222 ∼ 221. A total 30 nM of small RNA duplexes were transfected into HeLa cells. For dexamethasone treatment (lanes 3 and 4), HeLa cells were transfected with RNA duplexes and one day later, 100 nM of dexamethasone was treated for another 16 h. (B) RT-PCR demonstrates that p27 and p57 are suppressed by miR-222 ∼ 221 at the mRNA level. Total RNA was extracted from the same samples as in (A). (C) Western blot analysis. p27 and p57 are upregulated in the presence of the inhibitors of miR-222 and miR-221. SNU-638 cells were transfected with a mixture of antisense inhibitors against miR-222 and miR-221 (200 nM). (D) RT-PCR. The same samples as in (B) and (C) were used for quantitative real-time RT-PCR to measure p27 mRNA level. Endogenous GAPDH level was measured for normalization. (E and F) p27 and p57 are directly regulated by miR-222 ∼ 221 through the 3′-UTR. The reporters containing the 3′-UTR of p27 or p57 were transfected into HeLa (E) or SNU-638 (F) cells. At the same time, small RNA duplex [(E), 30 nM] or 2′-O-methyl RNA inhibitors [(F), 200 nM] were co-transfected, and luciferase expression was assayed 24 h-post-transfection (n = 3, mean±SD). Paired one-tail T-test was used to calculate the P-value (*P < 0.1, ***P < 0.001).
Figure 4.
Figure 4.
Direct regulation of Cip/Kip family proteins by miRNAs through their 3′-UTR sequences. (A) The 3′-UTR of p57 contains a single binding site for miR-25 and a single binding site for miR-222 ∼ 221. The same experiment as in Figure 2E was conducted, except that 1 nM of RNA duplexes were used to confirm the additive effect in this experiment (n = 3, mean±SD). (B) The 3′-UTR of p21 contains two binding sites for miR-106b. We generated mutations in the putative target sites, and a similar experiment as in (A) was conducted (n = 4, mean±SD). (C) The 3′-UTR of p27 harbors two putative binding sites for miR-222 ∼ 221. We tested the effects of mutations in the target sites as in (B) (n = 3, mean±SD). Paired one-tail T-test was used to calculate the p-value (*P < 0.1, **P < 0.01, ***P < 0.001).
Figure 5.
Figure 5.
Effects of miR-106b or miR-222 clusters on cell cycle. FACS analysis was performed using the cells transfected with either miRNA or miRNA inhibitors. (A) Thirty nanomoles of control siRNA (siGFP), miR-106b, miR-25, miR-222/221 or combinations of these miRNAs were transfected into SNU-638 or AGS cells. Two days later, cell-cycle profile was analyzed (n = 4, mean). (B) Antisense inhibitors of siLuc, miR-25, miR-106b or miR-222/221 were transfected into SNU-638 cells. Two days later, cell-cycle profile was analyzed by FACS (n = 9, mean). For each treatment, paired one-tail T-test was used to calculate the P-value.
Figure 6.
Figure 6.
Effect of miR-222 overexpression on tumor formation in nude mice. (A) The expression level of miR-222 in each stable cell line was measured by northern blot analysis. Ethidium bromide staining of rRNA was used for RNA loading control. (B) Stable cell lines were injected at the same time and the tumor formation in nude mice was monitored over a 4-week period. Four weeks later, the mice were sacrificed to obtain tumor masses. Average value of (C) tumor volume and (D) tumor weight were measured and shown with standard deviation (n = 5). Paired one-tail T-test was used to calculate the P-value (*P < 0.1).
Figure 7.
Figure 7.
Schematic model of the regulation of Cip/Kip family proteins by the miR-222 cluster and the miR-106b cluster. The miR-17 and miR-106a clusters are the paralogs of miR-106b cluster. miR-106 paralogs were recently shown to target p21 (18,19). The suppression of p27 and p57 by the miR-222 family was recently described by other groups (21–25). Solid lines indicate the experimentally confirmed inhibition from previous and our studies (see the text). The probable inhibition inferred from miRNA sequences are indicated with dotted lines.

References

    1. Filipowicz W, Bhattacharyya SN, Sonenberg N. Mechanisms of post-transcriptional regulation by microRNAs: are the answers in sight? Nat. Rev. Genet. 2008;9:102–114. - PubMed
    1. Griffiths-Jones S, Saini HK, van Dongen S, Enright AJ. miRBase: tools for microRNA genomics. Nucleic Acids Res. 2008;36:D154–D158. - PMC - PubMed
    1. Altuvia Y, Landgraf P, Lithwick G, Elefant N, Pfeffer S, Aravin A, Brownstein MJ, Tuschl T, Margalit H. Clustering and conservation patterns of human microRNAs. Nucleic Acids Res. 2005;33:2697–2706. - PMC - PubMed
    1. Lee Y, Jeon K, Lee JT, Kim S, Kim VN. MicroRNA maturation: stepwise processing and subcellular localization. EMBO J. 2002;21:4663–4670. - PMC - PubMed
    1. Lee Y, Kim M, Han J, Yeom KH, Lee S, Baek SH, Kim VN. MicroRNA genes are transcribed by RNA polymerase II. EMBO J. 2004;23:4051–4060. - PMC - PubMed

MeSH terms

Substances