. 2009 Mar 4;28(5):490-9.
doi: 10.1038/emboj.2008.307. Epub 2009 Jan 15.

TRPP2 channels regulate apoptosis through the Ca2+ concentration in the endoplasmic reticulum

Affiliations

TRPP2 channels regulate apoptosis through the Ca2+ concentration in the endoplasmic reticulum

Tomasz Wegierski et al. EMBO J. .

Abstract

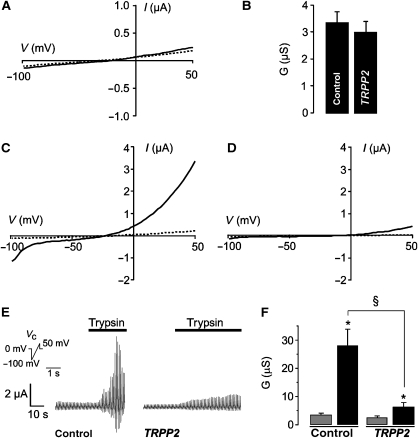
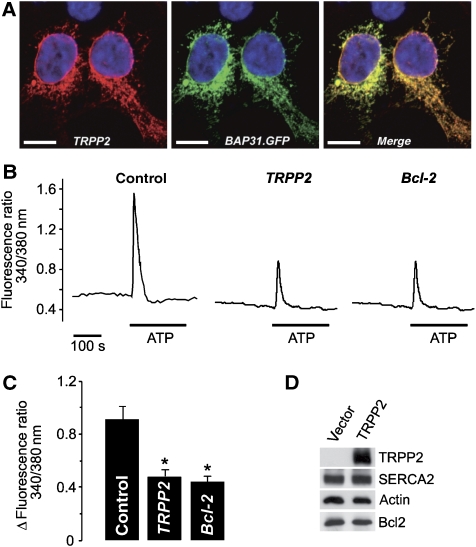
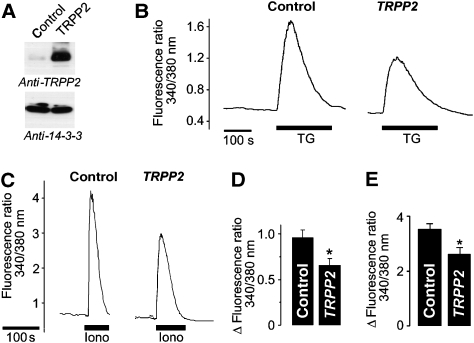
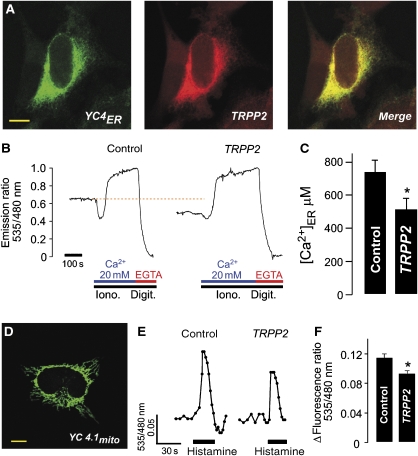
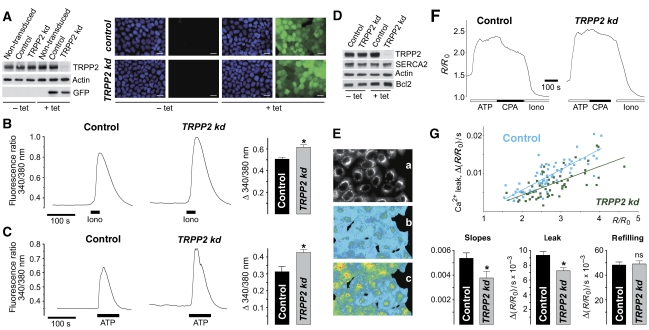
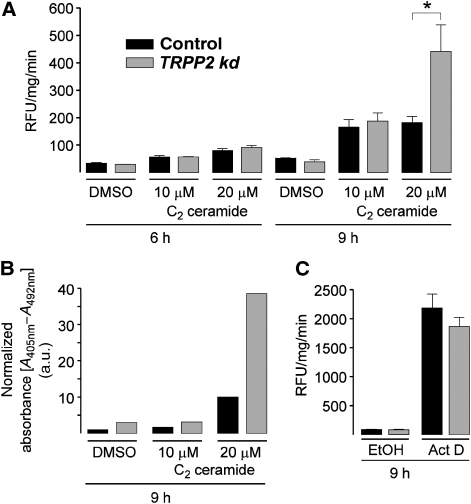
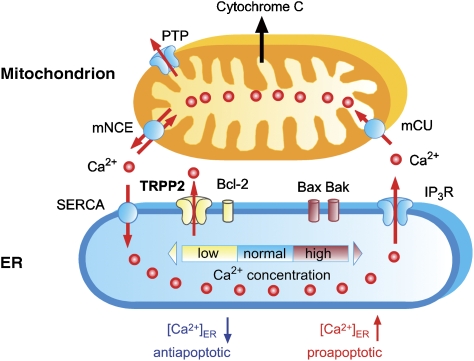
Ca(2+) is an important signalling molecule that regulates multiple cellular processes, including apoptosis. Although Ca(2+) influx through transient receptor potential (TRP) channels in the plasma membrane is known to trigger cell death, the function of intracellular TRP proteins in the regulation of Ca(2+)-dependent signalling pathways and apoptosis has remained elusive. Here, we show that TRPP2, the ion channel mutated in autosomal dominant polycystic kidney disease (ADPKD), protects cells from apoptosis by lowering the Ca(2+) concentration in the endoplasmic reticulum (ER). ER-resident TRPP2 counteracts the activity of the sarcoendoplasmic Ca(2+) ATPase by increasing the ER Ca(2+) permeability. This results in diminished cytosolic and mitochondrial Ca(2+) signals upon stimulation of inositol 1,4,5-trisphosphate receptors and reduces Ca(2+) release from the ER in response to apoptotic stimuli. Conversely, knockdown of TRPP2 in renal epithelial cells increases ER Ca(2+) release and augments sensitivity to apoptosis. Our findings indicate an important function of ER-resident TRPP2 in the modulation of intracellular Ca(2+) signalling, and provide a molecular mechanism for the increased apoptosis rates in ADPKD upon loss of TRPP2 channel function.


Figures

Figure 1
Figure 1
TRPP2 channel function in Xenopus oocytes. (A) Current–voltage (I–V) relations for oocytes expressing TRPP2 (dashed line) or water-injected control cells (solid line). (B) Group data from (A). Whole cell conductances (G) were calculated according to Ohm's law. (C) Current–voltage relations for control oocytes in control solution (dashed line) or after stimulation with trypsin (10 μg/ml; solid line). (D) Current–voltage relations in oocytes expressing TRPP2 in control solution (dashed line) or after stimulation with trypsin (solid line). (E) Time-course of the trypsin-induced whole cell currents in control cells and cells expressing TRPP2. Currents were recorded under voltage clamp conditions. Voltage clamp (Vc) protocol as depicted. (F) Group data from (E). Trypsin-induced whole cell conductances (black bars) were calculated at peak currents (grey bars: conductances in control solution). * and § indicate statistically significant differences as indicated.
Figure 2
Figure 2
TRPP2 localizes to the ER and modulates Ca2+ signalling. (A) HEK 293 cells transfected with TRPP2 and the ER marker BAP31.GFP (middle panel) were stained with anti-TRPP2 antibody (left panel, scale bar: 10 μm; blue: nuclear staining with Hoechst 33342). (B) Fura-2 Ca2+ measurements: effect of transient TRPP2 or Bcl-2 expression on Ca2+ release from intracellular stores in HEK 293 cells. Purinergic receptors were stimulated with 10 μM ATP in the absence of extracellular Ca2+. (C) Group data from (B) at peak Ca2+ increase (ATP-induced peak−baseline). (D) The levels of SERCA2 and Bcl-2 in the lysates of HEK 293 cells transfected with TRPP2-encoding plasmid or empty vector were analysed by western blotting.
Figure 3
Figure 3
TRPP2 decreases GPCR-independent release of Ca2+ from the ER. (A) Expression of TRPP2 in HeLa stable cell lines was examined by western blotting using anti-TRPP2 antibody (control: HeLa cells transduced with retrovirus generated from empty vector pLXSN; TRPP2: HeLa cells transduced with retrovirus encoding TRPP2). Levels of 14-3-3 proteins were analysed as a loading control. (B) Fura-2 Ca2+ measurements: effect of stable expression of TRPP2 in HeLa cells on the release of Ca2+ from the ER using thapsigargin (TG, 10 μM). (C) Effect of transient expression of TRPP2 in HEK 293 cells on the release of Ca2+ from the ER using ionomycin (Iono, 5 μM). Experiments in (B) and (C) were performed in the absence of extracellular Ca2+. (D) Group data from (B) at peak Ca2+ increase (TG-induced peak−baseline) (n=11). (E) Group data from (C) at peak Ca2+ increase (n=9).
Figure 4
Figure 4
TRPP2 decreases [Ca2+]ER and mitochondrial Ca2+ signals. (A) The ER-targeted Cameleon (YC4ER) co-localized with TRPP2 (immunodecorated with anti-TRPP2 antibody) in HeLa cells (scale bar: 10 μm). (B) Calibration of the normalized fluorescence emission ratio (535/480 nm) of YC4ER in cells co-transfected with empty vector (control) or TRPP2 (10 μM ionomycin, 0.5 μg/ml digitonin with either 20 mM Ca2+ or 5 mM EGTA). Note the decreased steady-state value in cells expressing TRPP2 (dashed orange line). (C) Steady-state Ca2+ concentration in the ER ([Ca2+]ER) in control and TRPP2-expressing cells calculated from a series of experiments as depicted in (B) (n=16 and 18, respectively). (D) A cameleon targeted to mitochondria (YC4.1mito) was expressed in HeLa cells (scale bar: 10 μm). (E) The fluorescence emission ratio (535/480 nm) of YC4.1mito was recorded in cells transfected with TRPP2 or empty vector (control) (10 μM histamine). (F) Group data from (E) at peak Ca2+ increase.
Figure 5
Figure 5
Ablation of TRPP2 in MDCK cells reduces the ER Ca2+ leak and results in increased amount of releasable Ca2+. (A) Analysis of MDCK cells conditionally expressing TRPP2-targeting (TRPP2 kd) or control shRNA cassettes, together with a GFP marker. The lysates prepared from the cells grown in the absence (− tet) and presence (+ tet) of tetracycline were analysed by western blotting. Inducible expression of GFP was also visualized by fluorescence microscopy (green). The nuclei were stained with Hoechst 33342 (blue). Scale bars: 10 μm. (B) Fura-2 cytosolic Ca2+ imaging of TRPP2-depleted (TRPP2 kd) and control cells upon treatment with 2 μM ionomycin (Iono) in the absence of extracellular Ca2+. Representative traces and group data are shown (peak values−baseline; n=7). (C) Experiment was performed as in (B), except that 10 μM ATP was used (n=6). (D) The levels of SERCA2 and Bcl-2 in the lysates prepared from control and TRPP2 kd cells were analysed by western blotting. (E) MDCK cells were loaded with the low-affinity Ca2+ indicator Mag-Fura-2 AM and permeabilized with digitonin to analyse the kinetics of Ca2+ pumping into the ER and its leak. The pictures show the fluorescence of Mag-Fura-2 (excited by 340 nm wavelength) localized in the intracellular stores after permeabilization (a), as well as their Ca2+ loading state (340/380 nm ratio is presented in pseudocolor) before (b) and after (c) refilling. (F) The graphs show the changes in the Ca2+ loading state of the intracellular stores (340/380 nm ratio R divided by the minimal ratio R0) in control and TRPP2-depleted (TRPP2 kd) cells. Refilling was initiated by the addition of 1.5 mM ATP and the Ca2+ leak was observed after inhibition of SERCA with 30 μM CPA. The minimal ratio R0 was found after depleting the stores with ionomycin (Iono; 2 μM). (G) Statistical analysis of the ER refilling and leak in the n=64 control cells and n=64 TRPP2-depleted cells from six and seven independent measurements, respectively. The calcium leak rate in each cell was plotted against R/R0 at the start of the CPA treatment, and the data were fitted into linear regression lines with the Excel software (y=bx+a, where b is 0.0054, a is −0.005, and correlation r=0.835 for control cells; b is 0.0038, a is −0.0032, and r=0.661 for TRPP2-depleted cells). The bar chart on the left shows the difference between the two regression slopes, and their standard errors (P=0.025). The remaining bar charts show the mean rates of the leak and refilling, and their standard errors.
Figure 6
Figure 6
Ablation of TRPP2 sensitizes the cells to apoptosis induced by ceramide but not by actinomycin D. (A) The caspase 3-like activity in TRPP2-depleted (TRPP2 kd; grey bars) and control (black bars) MDCK cells was measured after apoptosis induction with 10 or 20 μM C2-ceramide for 6 or 9 h. The activity is presented in relative fluorescence units (RFU) per minute and was normalized to 1 mg of total protein (n=4). (B) The relative amount of cytoplasmic nucleosomes in apoptotic cells after 9 h of treatment with the indicated doses of C2-ceramide was measured by ELISA, and normalized to total protein level in the cell lysates. The bar chart shows the data from one representative measurement. The assay was repeated three times yielding essentially the same results. (C) The apoptosis in TRPP2-depleted and control cells was induced with 0.5 μg/ml actinomycin D (Act D) for 9 h. The caspase 3-like activity was measured and presented as in (A) (n=3).
Figure 7
Figure 7
Simplified model of the ER Ca2+ gateway to apoptosis. Under physiological conditions, Ca2+ continuously cycles between the ER and mitochondria. Ca2+ ATPases (SERCA) pump Ca2+ into the ER from where it is released by IP3-gated channels (IP3R). A Ca2+ uniporter (mCU) mediates Ca2+ uptake into mitochondria and a mitochondrial Na+/Ca2+ exchanger (mNCE) releases Ca2+. Apoptotic stimuli can release Ca2+ from the ER, which results in mitochondrial Ca2+ signals. The magnitude of the mitochondrial Ca2+ signal and additional proapoptotic stimuli determine whether cytochrome c is released to trigger apoptosis. The amplitude of the mitochondrial Ca2+ signals depends on the Ca2+ content of the ER, which is maintained by the balance between active Ca2+ pumping by SERCA and passive Ca2+ exit from the ER. TRPP2 and Bcl-2 decrease the Ca2+ concentration in the ER ([Ca2+]ER) by increasing the passive Ca2+ exit pathway. This results in decreased mitochondrial Ca2+ signals, which cause reduced sensitivity to apoptosis. According to the ‘rheostat model' (Demaurex and Distelhorst, 2003), the ER Ca2+ load is regulated by the balance between anti- and proapoptotic Bcl-2 protein family members (Bcl-2 and Bax/Bak, respectively). Here, we introduce the cation channel TRPP2 as a novel antiapoptotic player in this model (modified from the review by Demaurex and Distelhorst, 2003).

References

    1. Arnaudeau S, Frieden M, Nakamura K, Castelbou C, Michalak M, Demaurex N (2002) Calreticulin differentially modulates calcium uptake and release in the endoplasmic reticulum and mitochondria. J Biol Chem 277: 46696–46705 - PubMed
    1. Arnaudeau S, Kelley WL, Walsh JV Jr, Demaurex N (2001) Mitochondria recycle Ca2+ to the endoplasmic reticulum and prevent the depletion of neighboring endoplasmic reticulum regions. J Biol Chem 276: 29430–29439 - PubMed
    1. Berridge MJ, Lipp P, Bootman MD (2000) The versatility and universality of calcium signalling. Nat Rev Mol Cell Biol 1: 11–21 - PubMed
    1. Boca M, Distefano G, Qian F, Bhunia AK, Germino GG, Boletta A (2006) Polycystin-1 induces resistance to apoptosis through the phosphatidylinositol 3-kinase/Akt signaling pathway. J Am Soc Nephrol 17: 637–647 - PMC - PubMed
    1. Boletta A, Germino GG (2003) Role of polycystins in renal tubulogenesis. Trends Cell Biol 13: 484–492 - PubMed

Publication types

Substances

LinkOut - more resources