. 2009 Feb 15;81(4):1693-8.
doi: 10.1021/ac8019202.

Peptide quantification using 8-plex isobaric tags and electron transfer dissociation tandem mass spectrometry

Affiliations

Peptide quantification using 8-plex isobaric tags and electron transfer dissociation tandem mass spectrometry

Doug Phanstiel et al. Anal Chem. .

Abstract

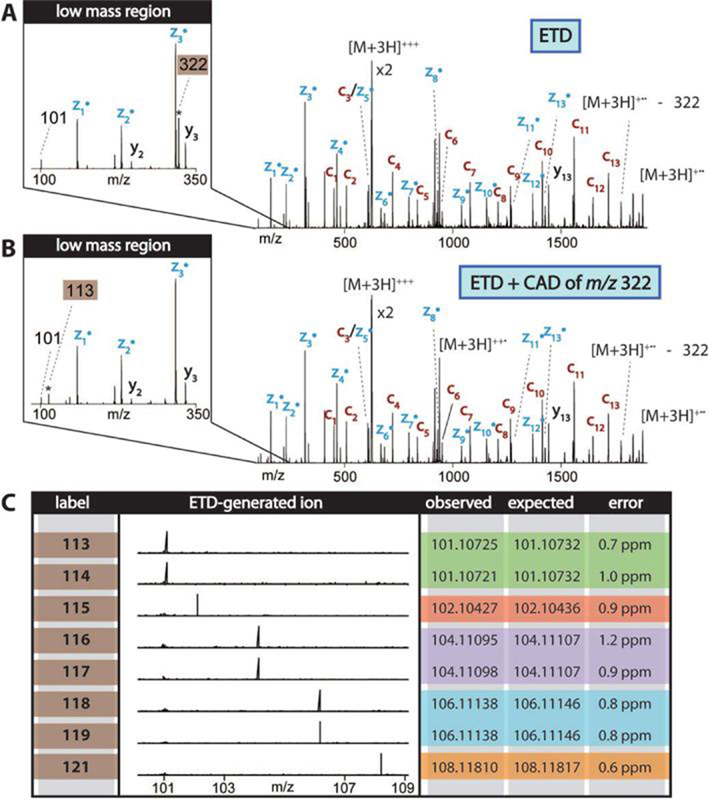
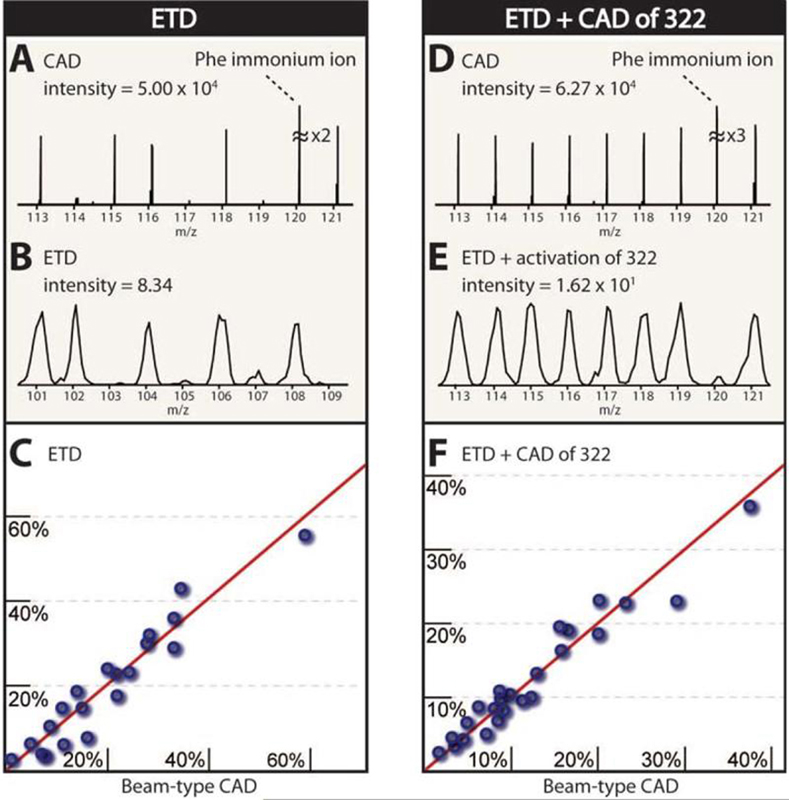
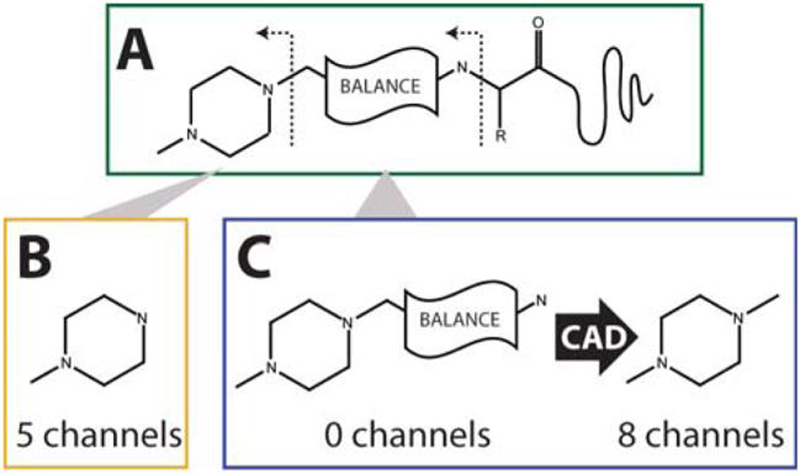
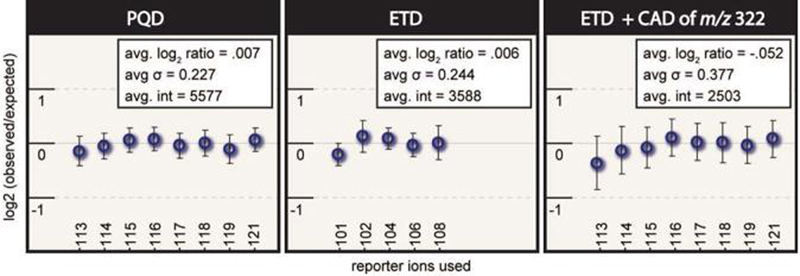
Isobaric tags for absolute and relative quantitation (iTRAQ) allow for simultaneous relative quantification of peptides from up to eight different samples. Typically peptides labeled with 8-plex iTRAQ tags are pooled and fragmented using beam-type collision activated dissociation (CAD) which, in addition to cleaving the peptide backbone bonds, cleaves the tag to produce reporter ions. The relative intensities of the reporters are directly proportional to the relative abundances of each peptide in the solution phase. Recently, studies using the 4-plex iTRAQ tagging reagent demonstrated that electron transfer dissociation (ETD) of 4-plex iTRAQ labeled peptides cleaves at the N-C alpha bond in the tag and allows for up to three channels of quantification. In this paper we investigate the ETD fragmentation patterns of peptides labeled with 8-plex iTRAQ tags. We demonstrate that upon ETD, peptides labeled with 8-plex iTRAQ tags fragment to produce unique reporter ions that allow for five channels of quantification. ETD-MS/MS of these labeled peptides also produces a peak at 322 m/z which, upon resonant excitation (CAD), gives rise to all eight iTRAQ reporter ions and allows for eight channels of quantification. Comparison of this method to beam-type CAD quantification shows a good correlation (y = 0.91x + 0.01, R(2) = 0.9383).


Figures

Figure 1
Figure 1
Fragmentation Patterns (a) Single scan ETD MS/MS analysis of EGVNDNEEGFFSAR labeled with the 113 iTRAQ tag with ion trap detection reveals all possible c- and z•- type ions. The liftout on the left shows the ETD-generated reporter ion at an m/z of 101 as well as a peak at an m/z of 322 representing the entire iTRAQ tag. (b) Single scan mass analysis of the same peptide following ETD and resonant excitation of the peak at m/z 322 results in a similar spectrum. The spectrum is not significantly different from the ETD spectrum except for the disappearance of the peak at 322 and the appearance of the peak at 113 seen in the liftout on the left. (c) The reporter regions of ETD MS/MS of EGVNDNEEGFFSAR labeled with each of the eight iTRAQ labels reveals five unique ETD generated reporter ions. The column on the left describes the iTRAQ tag that was interrogated. The spectra show orbitrap mass analysis of the ETD generated reporter ions. Detected masses, theoretical masses, and ppm error are shown on the right.
Figure 2
Figure 2
Evaluation of quantification (comparison to beam-type CAD) (Left) EGVNDNEEGFFSAR peptides were labeled with the 113, 115, 116, 118, and 121 iTRAQ tags, mixed in known ratios, infused into a hybrid linear ion trap-orbitrap mass spectrometer, and fragmented by beam-type CAD (a) and ETD (b). The reporter region from a single scan mass analysis of each is shown. (c) Four different mixes of the five labeled peptides were made. Ratios between samples ranged from 1:1 to 1:20. Plotted here are observed ratios via CAD on the x-axis and observed ratios via ETD on the y-axis. (Right) EGVNDNEEGFFSAR labeled with the all eight iTRAQ tags was mixed, infused into a hybrid linear ion trap-orbitrap mass spectrometer, and fragmented by beam-type CAD (d) and ETD with resonant excitation of 322 (e). Again, the reporter region from a single scan mass analysis of each is shown. (f) Three different mixes of the eight labeled peptides were made. Plotted here are observed ratios via CAD on the x-axis and observed ratios via ETD with resonant excitation of 322 on the y-axis.
Figure 3
Figure 3
Two approaches for iTRAQ quantification using ETD. (a) The structure of an iTRAQ tag as attached to a peptide is shown. ETD cleaves the 8-plex iTRAQ tag as indicated by the dotted lines. (b) Cleavage of the N-Cα bond of the tag results in reporter ions with the structure shown. Incorporation of different heavy isotopes allows for quantification of peptides from up to five different samples. (c) Cleavage of the N-Cα bond of the first amino acid or corresponding bond on the lysine side chain produces a peak at an m/z of 322 which does not provide quantitative information since it retains both the reporter and balance regions. However, resonant excitation of the peak at an m/z of 322 produces all eight reporter ions allowing for eight sample comparisons.
Figure 4
Figure 4
Protein quantification results. Average Log2 reporter ion ratios (observed/expected) are shown for each quantification strategy. Error bars depict standard deviations.

References

    1. Aebersold R, Mann M. Nature. 2003;422:198–207. - PubMed
    1. Bantscheff M, Schirle M, Sweetman G, Rick J, Kuster B. Anal. Bioanal. Chem. 2007;389:1017–1031. - PubMed
    1. Conrads TP, Issaq HJ, Veenstra TD. Biochem. Biophys. Res. Commun. 2002;290:885–890. - PubMed
    1. Heck AJR, Krijgsveld J. Expert Rev. Proteomics. 2004;1:317–326. - PubMed
    1. Julka S, Regnier F. J. Proteome Res. 2004;3:350–363. - PubMed

Publication types